

464
Multiscale Hydrologic Remote Sensing: Perspectives and Applications
(2002). Since GPP and ET are tightly coupled through stomatal control during photosynthesis, GPP can also be used to validate the ET product on a regional to a global
basis. High MODIS GPP should correspond to high ET, although the correlation
should not be perfect, as radiation drives GPP much more strongly than ET (Körner
1994; McMurtrie et al. 1992; Running and Kimball 2005). Figure 19.9b reveals that
areas with high annual MODIS GPP (Zhao et al., 2005) correspond favorably with
areas with high annual ET during 2000–2006. This validation effort will continue
during the development of the MODIS ET products.
19.6.2 SeaSonality and inteRannual vaRiaBility
The global ET products over 2000–2006 have also been analyzed to ascertain if they
reproduce well-known published findings of seasonality and interannual variability.
19.6.2.1 Seasonality
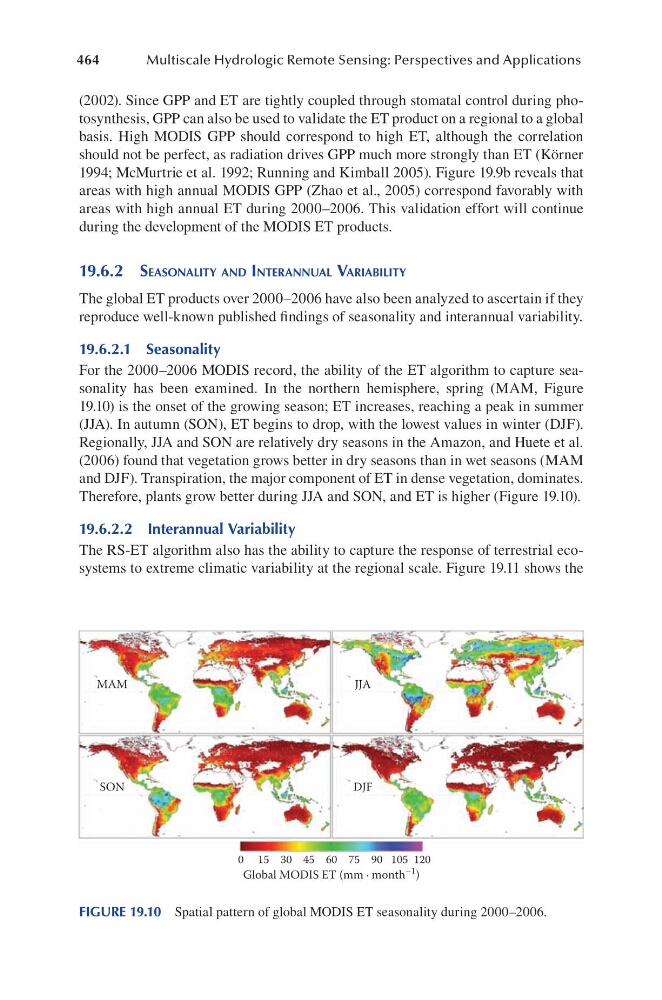
For the 2000–2006 MODIS record, the ability of the ET algorithm to capture seasonality has been examined. In the northern hemisphere, spring (MAM, Figure
19.10) is the onset of the growing season; ET increases, reaching a peak in summer
(JJA). In autumn (SON), ET begins to drop, with the lowest values in winter (DJF).
Regionally, JJA and SON are relatively dry seasons in the Amazon, and Huete et al.
(2006) found that vegetation grows better in dry seasons than in wet seasons (MAM
and DJF). Transpiration, the major component of ET in dense vegetation, dominates.
Therefore, plants grow better during JJA and SON, and ET is higher (Figure 19.10).
19.6.2.2 Interannual Variability
The RS-ET algorithm also has the ability to capture the response of terrestrial ecosystems to extreme climatic variability at the regional scale. Figure 19.11 shows the
MAM
JJA
SON
DJF
Global MODIS ET (mm ∙ month –1 )
0 15 30 45 60 75 90 105 120
FIGURE 19.10 Spatial pattern of global MODIS ET seasonality during 2000–2006.
Multiscale Hydrologic Remote Sensing: Perspectives and Applications
(2002). Since GPP and ET are tightly coupled through stomatal control during photosynthesis, GPP can also be used to validate the ET product on a regional to a global
basis. High MODIS GPP should correspond to high ET, although the correlation
should not be perfect, as radiation drives GPP much more strongly than ET (Körner
1994; McMurtrie et al. 1992; Running and Kimball 2005). Figure 19.9b reveals that
areas with high annual MODIS GPP (Zhao et al., 2005) correspond favorably with
areas with high annual ET during 2000–2006. This validation effort will continue
during the development of the MODIS ET products.
19.6.2 SeaSonality and inteRannual vaRiaBility
The global ET products over 2000–2006 have also been analyzed to ascertain if they
reproduce well-known published findings of seasonality and interannual variability.
19.6.2.1 Seasonality
For the 2000–2006 MODIS record, the ability of the ET algorithm to capture seasonality has been examined. In the northern hemisphere, spring (MAM, Figure
19.10) is the onset of the growing season; ET increases, reaching a peak in summer
(JJA). In autumn (SON), ET begins to drop, with the lowest values in winter (DJF).
Regionally, JJA and SON are relatively dry seasons in the Amazon, and Huete et al.
(2006) found that vegetation grows better in dry seasons than in wet seasons (MAM
and DJF). Transpiration, the major component of ET in dense vegetation, dominates.
Therefore, plants grow better during JJA and SON, and ET is higher (Figure 19.10).
19.6.2.2 Interannual Variability
The RS-ET algorithm also has the ability to capture the response of terrestrial ecosystems to extreme climatic variability at the regional scale. Figure 19.11 shows the
MAM
JJA
SON
DJF
Global MODIS ET (mm ∙ month –1 )
0 15 30 45 60 75 90 105 120
FIGURE 19.10 Spatial pattern of global MODIS ET seasonality during 2000–2006.