

461
Remote Sensing and Modeling of Global Evapotranspiration
150
125
100
75
50
25
0
150
125
100
75
50
25
0 0
25
50
75
100
125
150
Tower LE (W·m –2 )
MODIS-based LE (W · m –2
)
MODIS-based LE (W · m –2
)
Austin Cary, FL
Black Hills, SD
Blodgett Forest, CA
Campbell River, BC, Canada
Donaldson, FL
Duke, NC (pine)
Mize, FL
Nrn Old Black Spruce, SK, Canada
Niwot Ridge, CO
U. Mich. Biological Station, MI
Duke, NC (hardwood)
Kennedy SFC, FL
Barrow, AK
Tonzi Ranch, CA
Fort Peck, MT
Lethbridge, AB, Canada
Vaira Ranch, CA
Walnut Gulch, AZ
Bondville, IL
(a)
R = .86
(b)
R = .86
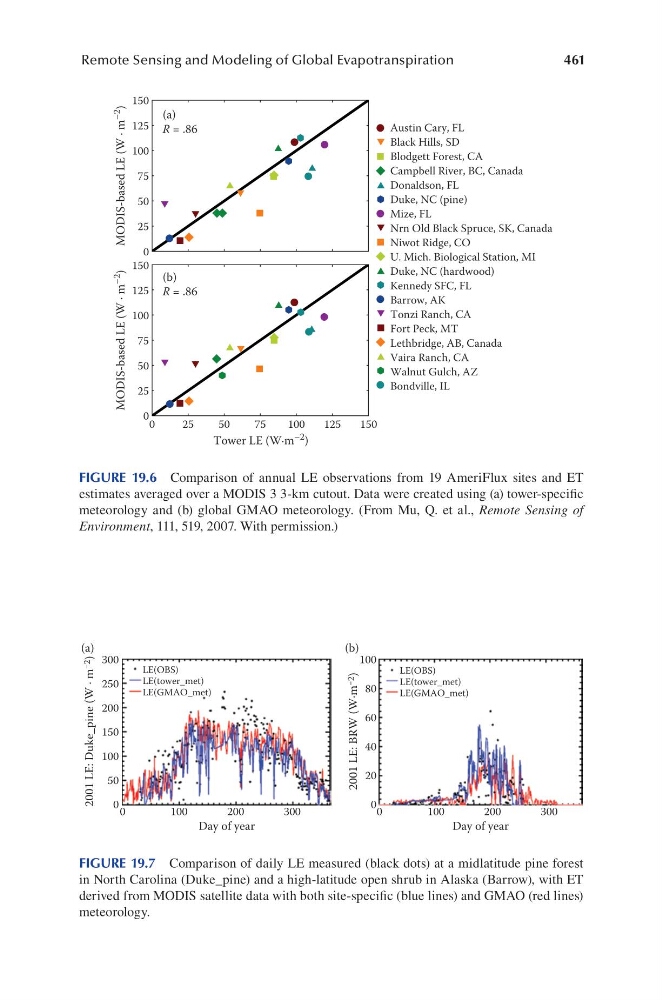
FIGURE 19.6 Comparison of annual LE observations from 19 AmeriFlux sites and ET
estimates averaged over a MODIS 3 3-km cutout. Data were created using (a) tower-specific
meteorology and (b) global GMAO meteorology. (From Mu, Q. et al., Remote Sensing of
Environment, 111, 519, 2007. With permission.)
300
250
200
150
100
50
0
100
(a)
(b)
LE(OBS)
LE(tower_met)
LE(GMAO_met)
LE(OBS)
LE(tower_met)
LE(GMAO_met)
80
60
40
20
0
0
100
200
Day of year
2001 LE: BRW (W∙m ‒2
)
2001 LE: Duke_pine (W ∙ m ‒2
)
300
0
100
200
Day of year
300
FIGURE 19.7 Comparison of daily LE measured (black dots) at a midlatitude pine forest
in North Carolina (Duke_pine) and a high-latitude open shrub in Alaska (Barrow), with ET
derived from MODIS satellite data with both site-specific (blue lines) and GMAO (red lines)
meteorology.
Remote Sensing and Modeling of Global Evapotranspiration
150
125
100
75
50
25
0
150
125
100
75
50
25
0 0
25
50
75
100
125
150
Tower LE (W·m –2 )
MODIS-based LE (W · m –2
)
MODIS-based LE (W · m –2
)
Austin Cary, FL
Black Hills, SD
Blodgett Forest, CA
Campbell River, BC, Canada
Donaldson, FL
Duke, NC (pine)
Mize, FL
Nrn Old Black Spruce, SK, Canada
Niwot Ridge, CO
U. Mich. Biological Station, MI
Duke, NC (hardwood)
Kennedy SFC, FL
Barrow, AK
Tonzi Ranch, CA
Fort Peck, MT
Lethbridge, AB, Canada
Vaira Ranch, CA
Walnut Gulch, AZ
Bondville, IL
(a)
R = .86
(b)
R = .86
FIGURE 19.6 Comparison of annual LE observations from 19 AmeriFlux sites and ET
estimates averaged over a MODIS 3 3-km cutout. Data were created using (a) tower-specific
meteorology and (b) global GMAO meteorology. (From Mu, Q. et al., Remote Sensing of
Environment, 111, 519, 2007. With permission.)
300
250
200
150
100
50
0
100
(a)
(b)
LE(OBS)
LE(tower_met)
LE(GMAO_met)
LE(OBS)
LE(tower_met)
LE(GMAO_met)
80
60
40
20
0
0
100
200
Day of year
2001 LE: BRW (W∙m ‒2
)
2001 LE: Duke_pine (W ∙ m ‒2
)
300
0
100
200
Day of year
300
FIGURE 19.7 Comparison of daily LE measured (black dots) at a midlatitude pine forest
in North Carolina (Duke_pine) and a high-latitude open shrub in Alaska (Barrow), with ET
derived from MODIS satellite data with both site-specific (blue lines) and GMAO (red lines)
meteorology.