

450
Multiscale Hydrologic Remote Sensing: Perspectives and Applications
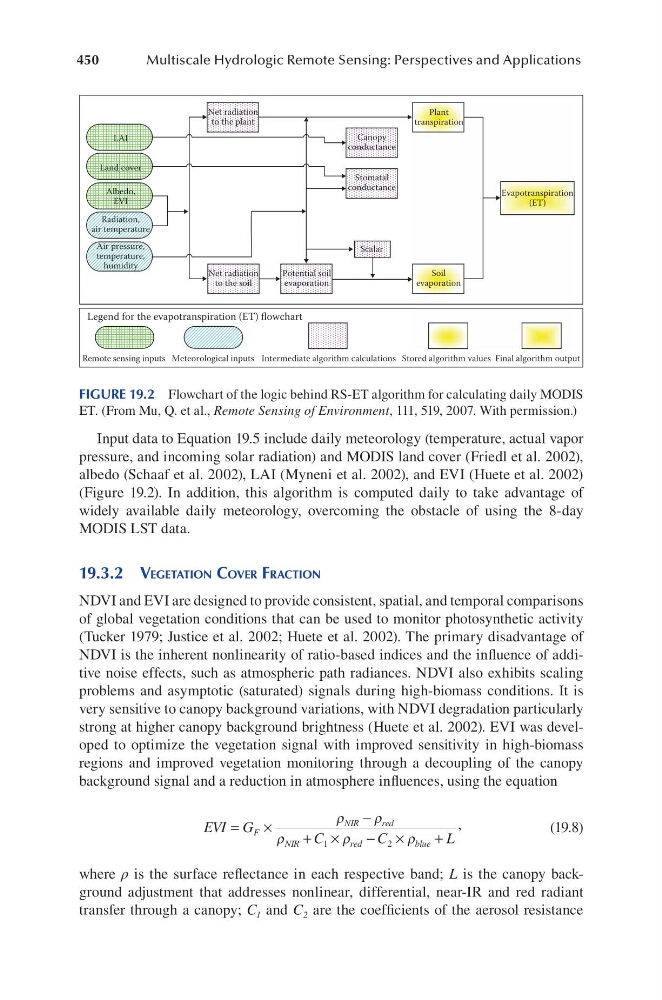
Input data to Equation 19.5 include daily meteorology (temperature, actual vapor
pressure, and incoming solar radiation) and MODIS land cover (Friedl et al. 2002),
albedo (Schaaf et al. 2002), LAI (Myneni et al. 2002), and EVI (Huete et al. 2002)
(Figure 19.2). In addition, this algorithm is computed daily to take advantage of
widely available daily meteorology, overcoming the obstacle of using the 8-day
MODIS LST data.
19.3.2 vegetation coveR fRaction
NDVI and EVI are designed to provide consistent, spatial, and temporal comparisons
of global vegetation conditions that can be used to monitor photosynthetic activity
(Tucker 1979; Justice et al. 2002; Huete et al. 2002). The primary disadvantage of
NDVI is the inherent nonlinearity of ratio-based indices and the influence of additive noise effects, such as atmospheric path radiances. NDVI also exhibits scaling
problems and asymptotic (saturated) signals during high-biomass conditions. It is
very sensitive to canopy background variations, with NDVI degradation particularly
strong at higher canopy background brightness (Huete et al. 2002). EVI was developed to optimize the vegetation signal with improved sensitivity in high-biomass
regions and improved vegetation monitoring through a decoupling of the canopy
background signal and a reduction in atmosphere influences, using the equation
EVI G
C
C
L
F
NIR
red
NIR
red
blue
=
×
−
+ ×
− ×
+
ρ
ρ
ρ
ρ
ρ
1
2
,
(19.8)
where ρ is the surface reflectance in each respective band; L is the canopy background adjustment that addresses nonlinear, differential, near-IR and red radiant
transfer through a canopy; C 1 and C 2 are the coefficients of the aerosol resistance
Legend for the evapotranspiration (ET) flowchart
Remote sensing inputs Meteorological inputs Intermediate algorithm calculations Stored algorithm values Final algorithm output
LAI
Land cover
Albedo,
EVI
Radiation,
air temperature
Air pressure,
temperature,
humidity
Net radiation
to the soil
Net radiation
to the plant
Potential soil
evaporation
Scalar
Stomatal
conductance
Canopy
conductance
Plant
transpiration
Evapotranspiration
(ET)
Soil
evaporation
FIGURE 19.2 Flowchart of the logic behind RS-ET algorithm for calculating daily MODIS
ET. (From Mu, Q. et al., Remote Sensing of Environment, 111, 519, 2007. With permission.)
Multiscale Hydrologic Remote Sensing: Perspectives and Applications
Input data to Equation 19.5 include daily meteorology (temperature, actual vapor
pressure, and incoming solar radiation) and MODIS land cover (Friedl et al. 2002),
albedo (Schaaf et al. 2002), LAI (Myneni et al. 2002), and EVI (Huete et al. 2002)
(Figure 19.2). In addition, this algorithm is computed daily to take advantage of
widely available daily meteorology, overcoming the obstacle of using the 8-day
MODIS LST data.
19.3.2 vegetation coveR fRaction
NDVI and EVI are designed to provide consistent, spatial, and temporal comparisons
of global vegetation conditions that can be used to monitor photosynthetic activity
(Tucker 1979; Justice et al. 2002; Huete et al. 2002). The primary disadvantage of
NDVI is the inherent nonlinearity of ratio-based indices and the influence of additive noise effects, such as atmospheric path radiances. NDVI also exhibits scaling
problems and asymptotic (saturated) signals during high-biomass conditions. It is
very sensitive to canopy background variations, with NDVI degradation particularly
strong at higher canopy background brightness (Huete et al. 2002). EVI was developed to optimize the vegetation signal with improved sensitivity in high-biomass
regions and improved vegetation monitoring through a decoupling of the canopy
background signal and a reduction in atmosphere influences, using the equation
EVI G
C
C
L
F
NIR
red
NIR
red
blue
=
×
−
+ ×
− ×
+
ρ
ρ
ρ
ρ
ρ
1
2
,
(19.8)
where ρ is the surface reflectance in each respective band; L is the canopy background adjustment that addresses nonlinear, differential, near-IR and red radiant
transfer through a canopy; C 1 and C 2 are the coefficients of the aerosol resistance
Legend for the evapotranspiration (ET) flowchart
Remote sensing inputs Meteorological inputs Intermediate algorithm calculations Stored algorithm values Final algorithm output
LAI
Land cover
Albedo,
EVI
Radiation,
air temperature
Air pressure,
temperature,
humidity
Net radiation
to the soil
Net radiation
to the plant
Potential soil
evaporation
Scalar
Stomatal
conductance
Canopy
conductance
Plant
transpiration
Evapotranspiration
(ET)
Soil
evaporation
FIGURE 19.2 Flowchart of the logic behind RS-ET algorithm for calculating daily MODIS
ET. (From Mu, Q. et al., Remote Sensing of Environment, 111, 519, 2007. With permission.)