

424
Multiscale Hydrologic Remote Sensing: Perspectives and Applications
parameters are inversely related to NDVI. These patterns were examined in more
detail by continent in the following section.
18.4.2.1 Eurasia
The overall patterns of both the optical- and microwave-derived vegetation indices
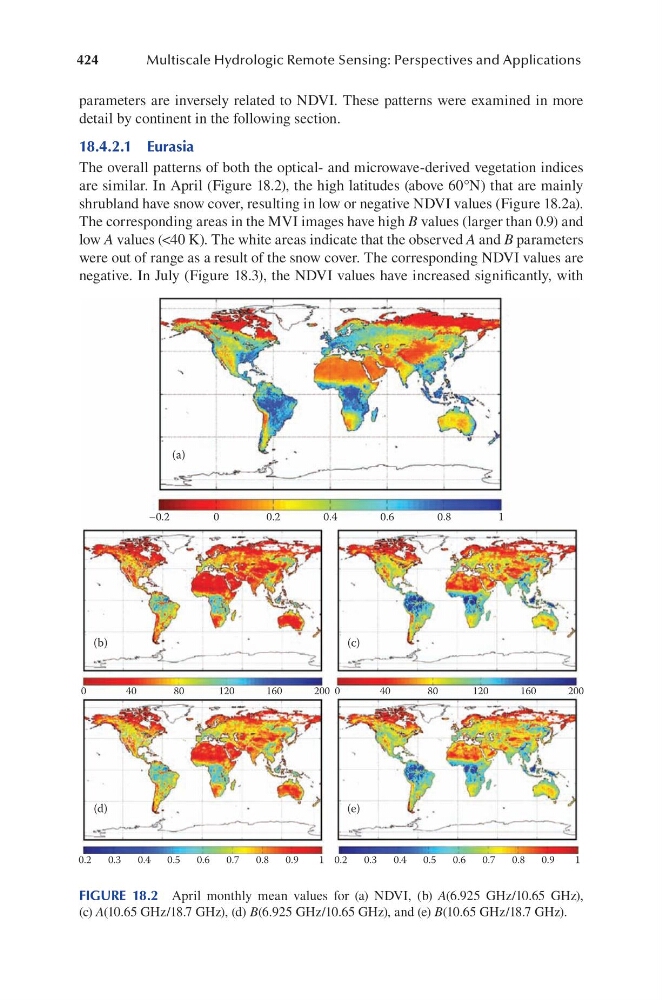
are similar. In April (Figure 18.2), the high latitudes (above 60°N) that are mainly
shrubland have snow cover, resulting in low or negative NDVI values (Figure 18.2a).
The corresponding areas in the MVI images have high B values (larger than 0.9) and
low A values (<40 K). The white areas indicate that the observed A and B parameters
were out of range as a result of the snow cover. The corresponding NDVI values are
negative. In July (Figure 18.3), the NDVI values have increased significantly, with
(a)
(b)
(c)
(d)
(e)
–0.2
0.2
0.4
0.6
0.8
1
0
0
0.2
0.3
0.4
0.5
0.6
0.7
0.8
0.9
1 0.2
0.3
0.4
0.5
0.6
0.7
0.8
0.9
1
40
80
120
160
200 0
40
80
120
160
200
FIGURE 18.2 April monthly mean values for (a) NDVI, (b) A(6.925 GHz/10.65 GHz),
(c) A(10.65 GHz/18.7 GHz), (d) B(6.925 GHz/10.65 GHz), and (e) B(10.65 GHz/18.7 GHz).
Multiscale Hydrologic Remote Sensing: Perspectives and Applications
parameters are inversely related to NDVI. These patterns were examined in more
detail by continent in the following section.
18.4.2.1 Eurasia
The overall patterns of both the optical- and microwave-derived vegetation indices
are similar. In April (Figure 18.2), the high latitudes (above 60°N) that are mainly
shrubland have snow cover, resulting in low or negative NDVI values (Figure 18.2a).
The corresponding areas in the MVI images have high B values (larger than 0.9) and
low A values (<40 K). The white areas indicate that the observed A and B parameters
were out of range as a result of the snow cover. The corresponding NDVI values are
negative. In July (Figure 18.3), the NDVI values have increased significantly, with
(a)
(b)
(c)
(d)
(e)
–0.2
0.2
0.4
0.6
0.8
1
0
0
0.2
0.3
0.4
0.5
0.6
0.7
0.8
0.9
1 0.2
0.3
0.4
0.5
0.6
0.7
0.8
0.9
1
40
80
120
160
200 0
40
80
120
160
200
FIGURE 18.2 April monthly mean values for (a) NDVI, (b) A(6.925 GHz/10.65 GHz),
(c) A(10.65 GHz/18.7 GHz), (d) B(6.925 GHz/10.65 GHz), and (e) B(10.65 GHz/18.7 GHz).