

416
Multiscale Hydrologic Remote Sensing: Perspectives and Applications
increases, the vegetation emission component V e will increase, and the vegetation
transmission component V t will decrease at a given frequency, vegetation fraction
cover, and physical temperature. For bare surfaces, when F v is zero V e will be zero,
and V t /T s will be unity. On the other hand, V t will approach zero for very thick vegetation cover such as a very dense forest when the sensor cannot “see” the ground.
Typically, V e is a positive number (greater than zero), and V t /T s is a number between
zero and unity for vegetated surfaces when T s ≈ T v .
18.2.2 chaRacteRiSticS of BaRe SuRface eMiSSion SignalS
in two adjacent aMSR-e fRequencieS
To characterize the frequency dependence of surface emission signals with the
objective of minimizing the effects of the ground surface emission signals in deriving microwave vegetation indices, we first evaluated the characteristics of bare surface emission signals at different AMSR-E frequencies. This was done by generating
a simulated surface emission database for the sensor parameters of AMSR-E with
frequencies, 6.925, 10.65, and 18.7 GHz of polarizations v and h, and an incidence
angle of 55° using the advanced integral equation model (AIEM) (Chen et al. 2003).
This database included a wide range of volumetric soil moistures (2%–44% at a 2%
interval). Surface roughness parameters included the root mean square (rms) height
from 0.25 to 3 cm at a 0.25-cm interval and correlation length from 2.5 to 30 cm at a
2.5-cm interval. In total, there were 2904 simulated emissivities for each frequency
and polarization. The commonly used Gaussian correlation function was used in
the simulation, since it is a good approximation for the microwave measurement
frequencies of this study.
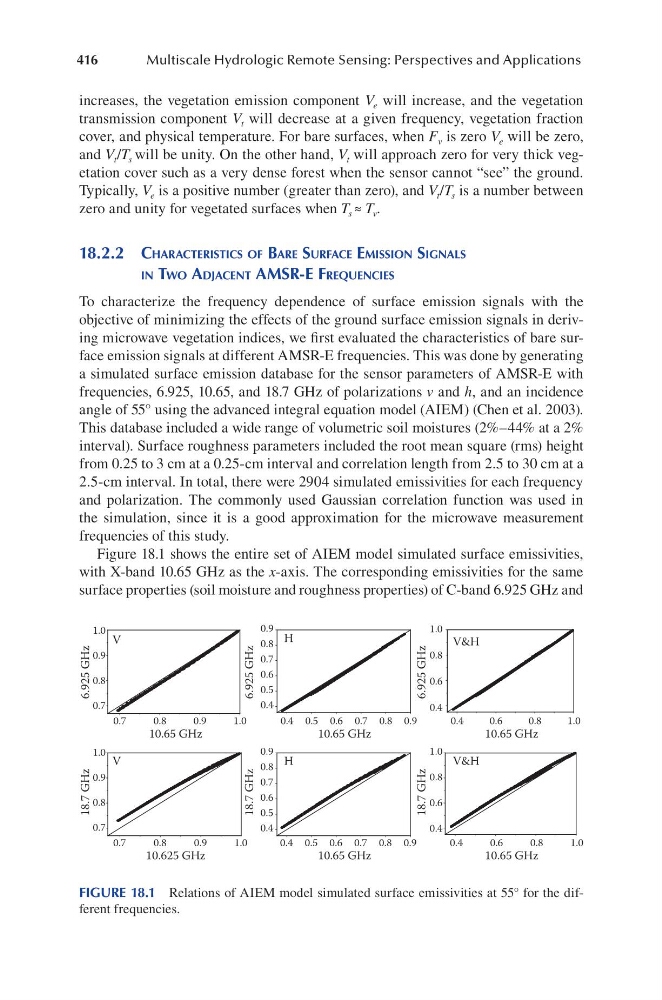
Figure 18.1 shows the entire set of AIEM model simulated surface emissivities,
with X-band 10.65 GHz as the x-axis. The corresponding emissivities for the same
surface properties (soil moisture and roughness properties) of C-band 6.925 GHz and
10.65 GHz
0.7
0.8
0.9
1.0
6.925 GHz
0.7
0.8
0.9
1.0 V
10.65 GHz
0.4 0.5 0.6 0.7 0.8 0.9
0.4
0.5
0.6
0.7
0.8
0.9 H
10.65 GHz
0.4
0.6
0.8
1.0
0.4
0.6
0.8
1.0
V&H
10.625 GHz
0.7
0.8
0.9
1.0
18.7 GHz
6.925 GHz
18.7 GHz
6.925 GHz
18.7 GHz
0.7
0.8
0.9
1.0 V
10.65 GHz
0.4 0.5 0.6 0.7 0.8 0.9
0.4
0.5
0.6
0.7
0.8
0.9 H
10.65 GHz
0.4
0.6
0.8
1.0
0.4
0.6
0.8
1.0 V&H
FIGURE 18.1 Relations of AIEM model simulated surface emissivities at 55° for the different frequencies.
Multiscale Hydrologic Remote Sensing: Perspectives and Applications
increases, the vegetation emission component V e will increase, and the vegetation
transmission component V t will decrease at a given frequency, vegetation fraction
cover, and physical temperature. For bare surfaces, when F v is zero V e will be zero,
and V t /T s will be unity. On the other hand, V t will approach zero for very thick vegetation cover such as a very dense forest when the sensor cannot “see” the ground.
Typically, V e is a positive number (greater than zero), and V t /T s is a number between
zero and unity for vegetated surfaces when T s ≈ T v .
18.2.2 chaRacteRiSticS of BaRe SuRface eMiSSion SignalS
in two adjacent aMSR-e fRequencieS
To characterize the frequency dependence of surface emission signals with the
objective of minimizing the effects of the ground surface emission signals in deriving microwave vegetation indices, we first evaluated the characteristics of bare surface emission signals at different AMSR-E frequencies. This was done by generating
a simulated surface emission database for the sensor parameters of AMSR-E with
frequencies, 6.925, 10.65, and 18.7 GHz of polarizations v and h, and an incidence
angle of 55° using the advanced integral equation model (AIEM) (Chen et al. 2003).
This database included a wide range of volumetric soil moistures (2%–44% at a 2%
interval). Surface roughness parameters included the root mean square (rms) height
from 0.25 to 3 cm at a 0.25-cm interval and correlation length from 2.5 to 30 cm at a
2.5-cm interval. In total, there were 2904 simulated emissivities for each frequency
and polarization. The commonly used Gaussian correlation function was used in
the simulation, since it is a good approximation for the microwave measurement
frequencies of this study.
Figure 18.1 shows the entire set of AIEM model simulated surface emissivities,
with X-band 10.65 GHz as the x-axis. The corresponding emissivities for the same
surface properties (soil moisture and roughness properties) of C-band 6.925 GHz and
10.65 GHz
0.7
0.8
0.9
1.0
6.925 GHz
0.7
0.8
0.9
1.0 V
10.65 GHz
0.4 0.5 0.6 0.7 0.8 0.9
0.4
0.5
0.6
0.7
0.8
0.9 H
10.65 GHz
0.4
0.6
0.8
1.0
0.4
0.6
0.8
1.0
V&H
10.625 GHz
0.7
0.8
0.9
1.0
18.7 GHz
6.925 GHz
18.7 GHz
6.925 GHz
18.7 GHz
0.7
0.8
0.9
1.0 V
10.65 GHz
0.4 0.5 0.6 0.7 0.8 0.9
0.4
0.5
0.6
0.7
0.8
0.9 H
10.65 GHz
0.4
0.6
0.8
1.0
0.4
0.6
0.8
1.0 V&H
FIGURE 18.1 Relations of AIEM model simulated surface emissivities at 55° for the different frequencies.