

24
Multiscale Hydrologic Remote Sensing: Perspectives and Applications
inversion in the time domain, focusing on the surface reflection. Topp’s relationship
(Topp et al. 1980; Equation 2.5) was used to infer soil moisture from inversely estimated permittivity. At the same field site, Topp’s relationship was known to provide
good results (Weihermüller et al. 2007), with an RMSE of 0.021 m 3 /m 3 between the
volumetric soil sample and TDR estimates.
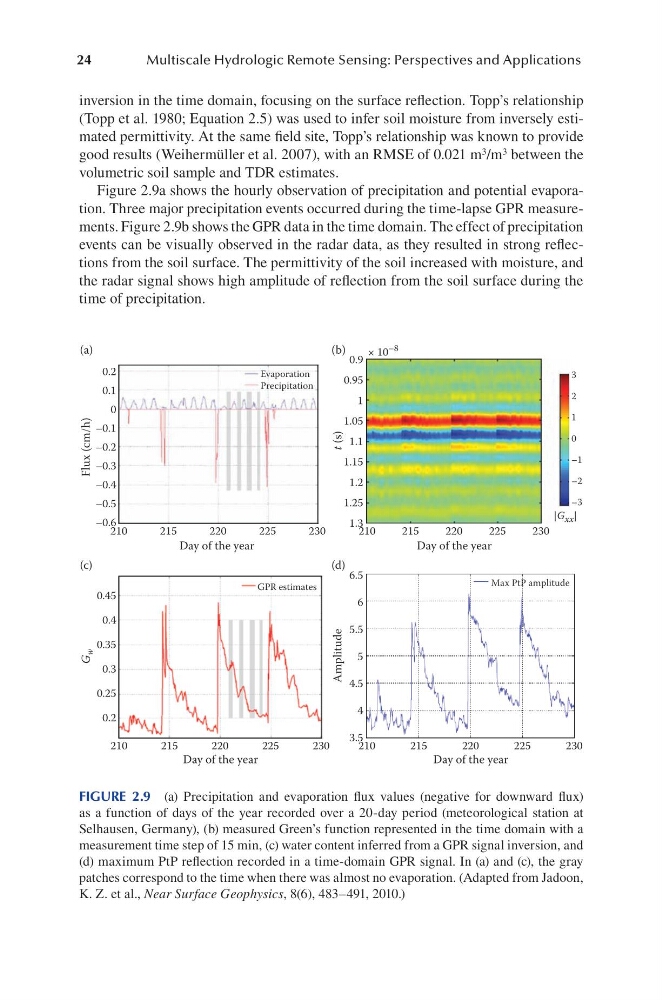
Figure 2.9a shows the hourly observation of precipitation and potential evaporation. Three major precipitation events occurred during the time-lapse GPR measurements. Figure 2.9b shows the GPR data in the time domain. The effect of precipitation
events can be visually observed in the radar data, as they resulted in strong reflections from the soil surface. The permittivity of the soil increased with moisture, and
the radar signal shows high amplitude of reflection from the soil surface during the
time of precipitation.
0.2
0.9
× 10 –8
0.95
1
1.05
1.1
1.15
1.2
1.25
1.3
0.1
0
–0.1
–0.2
–0.3
–0.4
–0.5
–0.6
0.45
6.5
6
5.5
5
4.5
4
3.5
0.4
0.35
0.3
0.25
0.2
210
215
220
225
230
Day of the year
210
215
220
225
230
Day of the year
210
215
220
225
230
Day of the year
Amplitude
t (s)
Flux (cm/h)
G
w
210
215
220
225
230
Day of the year
Evaporation
Precipitation
GPR estimates
Max PtP amplitude
3
2
1
0
–1
–2
–3
|G xx |
(a)
(b)
(c)
(d)
FIGURE 2.9 (a) Precipitation and evaporation flux values (negative for downward flux)
as a function of days of the year recorded over a 20-day period (meteorological station at
Selhausen, Germany), (b) measured Green’s function represented in the time domain with a
measurement time step of 15 min, (c) water content inferred from a GPR signal inversion, and
(d) maximum PtP reflection recorded in a time-domain GPR signal. In (a) and (c), the gray
patches correspond to the time when there was almost no evaporation. (Adapted from Jadoon,
K. Z. et al., Near Surface Geophysics, 8(6), 483–491, 2010.)
Multiscale Hydrologic Remote Sensing: Perspectives and Applications
inversion in the time domain, focusing on the surface reflection. Topp’s relationship
(Topp et al. 1980; Equation 2.5) was used to infer soil moisture from inversely estimated permittivity. At the same field site, Topp’s relationship was known to provide
good results (Weihermüller et al. 2007), with an RMSE of 0.021 m 3 /m 3 between the
volumetric soil sample and TDR estimates.
Figure 2.9a shows the hourly observation of precipitation and potential evaporation. Three major precipitation events occurred during the time-lapse GPR measurements. Figure 2.9b shows the GPR data in the time domain. The effect of precipitation
events can be visually observed in the radar data, as they resulted in strong reflections from the soil surface. The permittivity of the soil increased with moisture, and
the radar signal shows high amplitude of reflection from the soil surface during the
time of precipitation.
0.2
0.9
× 10 –8
0.95
1
1.05
1.1
1.15
1.2
1.25
1.3
0.1
0
–0.1
–0.2
–0.3
–0.4
–0.5
–0.6
0.45
6.5
6
5.5
5
4.5
4
3.5
0.4
0.35
0.3
0.25
0.2
210
215
220
225
230
Day of the year
210
215
220
225
230
Day of the year
210
215
220
225
230
Day of the year
Amplitude
t (s)
Flux (cm/h)
G
w
210
215
220
225
230
Day of the year
Evaporation
Precipitation
GPR estimates
Max PtP amplitude
3
2
1
0
–1
–2
–3
|G xx |
(a)
(b)
(c)
(d)
FIGURE 2.9 (a) Precipitation and evaporation flux values (negative for downward flux)
as a function of days of the year recorded over a 20-day period (meteorological station at
Selhausen, Germany), (b) measured Green’s function represented in the time domain with a
measurement time step of 15 min, (c) water content inferred from a GPR signal inversion, and
(d) maximum PtP reflection recorded in a time-domain GPR signal. In (a) and (c), the gray
patches correspond to the time when there was almost no evaporation. (Adapted from Jadoon,
K. Z. et al., Near Surface Geophysics, 8(6), 483–491, 2010.)