

23
Advanced Ground-Penetrating Radar for Soil Moisture Retrieval
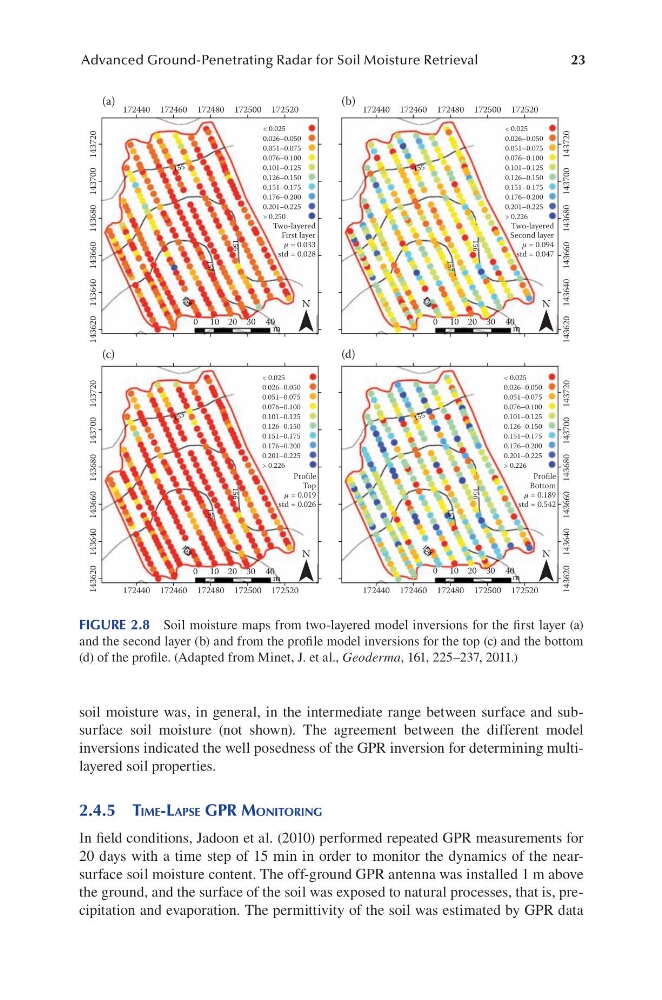
soil moisture was, in general, in the intermediate range between surface and subsurface soil moisture (not shown). The agreement between the different model
inversions indicated the well posedness of the GPR inversion for determining multilayered soil properties.
2.4.5 tiMe-laPSe gPR MonitoRing
In field conditions, Jadoon et al. (2010) performed repeated GPR measurements for
20 days with a time step of 15 min in order to monitor the dynamics of the nearsurface soil moisture content. The off-ground GPR antenna was installed 1 m above
the ground, and the surface of the soil was exposed to natural processes, that is, precipitation and evaporation. The permittivity of the soil was estimated by GPR data
172440
143620 143640 143660 143680 143700 143720
143620 143640 143660 143680 143700 143720
143620 143640 143660 143680 143700 143720
143620 143640 143660 143680 143700 143720
172460 172480 172500 172520
Two-layered
First layer
µ = 0.033
std = 0.028
Profile
Top
µ = 0.019
std = 0.026
Profile
Bottom
µ = 0.189
std = 0.542
172440 172460 172480 172500 172520
172440 172460 172480 172500 172520
172440 172460 172480 172500 172520
< 0.025
0.026–0.050
0.051–0.075
0.076–0.100
0.101–0.125
0.126–0.150
0.151–0.175
0.176–0.200
0.201–0.225
> 0.250
< 0.025
0.026–0.050
0.051–0.075
0.076–0.100
0.101–0.125
0.126–0.150
0.151–0.175
0.176–0.200
0.201–0.225
> 0.226
< 0.025
0.026–0.050
0.051–0.075
0.076–0.100
0.101–0.125
0.126–0.150
0.151–0.175
0.176–0.200
0.201–0.225
> 0.226
< 0.025
0.026–0.050
0.051–0.075
0.076–0.100
0.101–0.125
0.126–0.150
0.151–0.175
0.176–0.200
0.201–0.225
> 0.226
Two-layered
Second layer
µ = 0.094
std = 0.047
N
N
N
N
0 10 20 30 40
m
0 10 20 30 40
m
0 10 20 30 40
m
0 10 20 30 40
m
155
156
157
1 5 8
155
156
157
1 5 8
15 5
156
157
1
5
8
15 5
156
157
1 5 8
(a)
(b)
(c)
(d)
FIGURE 2.8 Soil moisture maps from two-layered model inversions for the first layer (a)
and the second layer (b) and from the profile model inversions for the top (c) and the bottom
(d) of the profile. (Adapted from Minet, J. et al., Geoderma, 161, 225–237, 2011.)
Advanced Ground-Penetrating Radar for Soil Moisture Retrieval
soil moisture was, in general, in the intermediate range between surface and subsurface soil moisture (not shown). The agreement between the different model
inversions indicated the well posedness of the GPR inversion for determining multilayered soil properties.
2.4.5 tiMe-laPSe gPR MonitoRing
In field conditions, Jadoon et al. (2010) performed repeated GPR measurements for
20 days with a time step of 15 min in order to monitor the dynamics of the nearsurface soil moisture content. The off-ground GPR antenna was installed 1 m above
the ground, and the surface of the soil was exposed to natural processes, that is, precipitation and evaporation. The permittivity of the soil was estimated by GPR data
172440
143620 143640 143660 143680 143700 143720
143620 143640 143660 143680 143700 143720
143620 143640 143660 143680 143700 143720
143620 143640 143660 143680 143700 143720
172460 172480 172500 172520
Two-layered
First layer
µ = 0.033
std = 0.028
Profile
Top
µ = 0.019
std = 0.026
Profile
Bottom
µ = 0.189
std = 0.542
172440 172460 172480 172500 172520
172440 172460 172480 172500 172520
172440 172460 172480 172500 172520
< 0.025
0.026–0.050
0.051–0.075
0.076–0.100
0.101–0.125
0.126–0.150
0.151–0.175
0.176–0.200
0.201–0.225
> 0.250
< 0.025
0.026–0.050
0.051–0.075
0.076–0.100
0.101–0.125
0.126–0.150
0.151–0.175
0.176–0.200
0.201–0.225
> 0.226
< 0.025
0.026–0.050
0.051–0.075
0.076–0.100
0.101–0.125
0.126–0.150
0.151–0.175
0.176–0.200
0.201–0.225
> 0.226
< 0.025
0.026–0.050
0.051–0.075
0.076–0.100
0.101–0.125
0.126–0.150
0.151–0.175
0.176–0.200
0.201–0.225
> 0.226
Two-layered
Second layer
µ = 0.094
std = 0.047
N
N
N
N
0 10 20 30 40
m
0 10 20 30 40
m
0 10 20 30 40
m
0 10 20 30 40
m
155
156
157
1 5 8
155
156
157
1 5 8
15 5
156
157
1
5
8
15 5
156
157
1 5 8
(a)
(b)
(c)
(d)
FIGURE 2.8 Soil moisture maps from two-layered model inversions for the first layer (a)
and the second layer (b) and from the profile model inversions for the top (c) and the bottom
(d) of the profile. (Adapted from Minet, J. et al., Geoderma, 161, 225–237, 2011.)