

382
Multiscale Hydrologic Remote Sensing: Perspectives and Applications
.gov/). GHM has been run on multiple years of TRMM precipitation data with the
averaged annual runoff (1999–2008) comparing well with GRDC gauge observations
(Hong et al. 2007b). It consistently performs well over the locations of 488 gauge stations
that represent 72% catchment coverage of actively discharging land surface (excluding
Antarctica, the glaciated portion of Greenland, and the Canadian Arctic Archipelago).
Since 2010, the second version of GHM, the distributed Coupled Routing and
Excess STorage (CREST) (Wang et al. 2011) hydrological model, has been jointly
developed by the University of Oklahoma (http://hydro.ou.edu) and NASA SERVIR
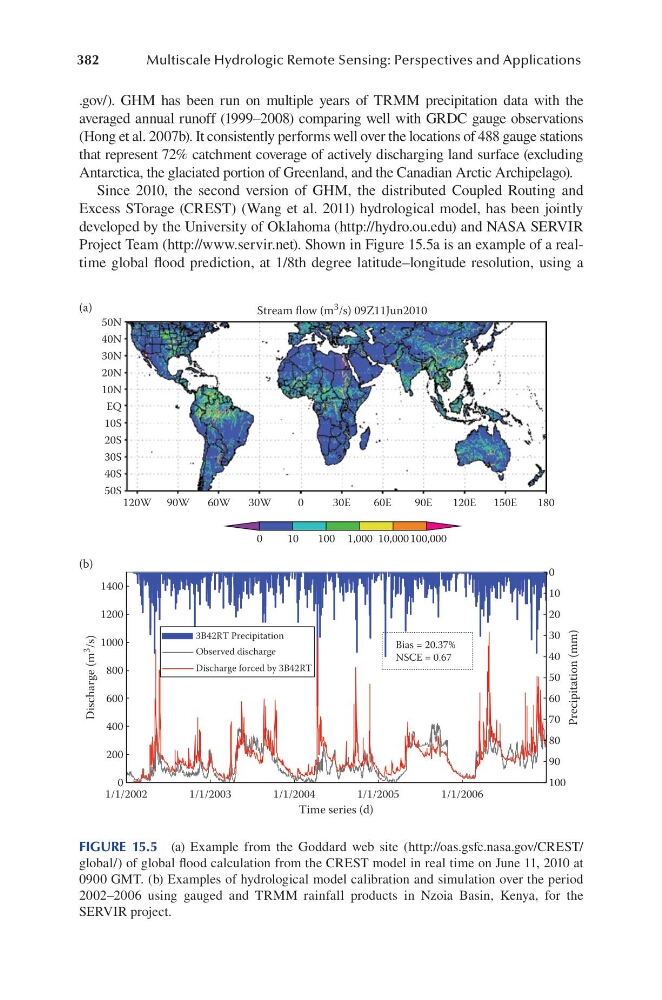
Project Team (http://www.servir.net). Shown in Figure 15.5a is an example of a realtime global flood prediction, at 1/8th degree latitude–longitude resolution, using a
(a)
(b)
0
200
400
600
800
1000
1200
1400
1/1/2002
1/1/2003
1/1/2004
1/1/2005
1/1/2006
Time series (d)
Stream flow (m 3 /s) 09Z11Jun2010
Discharge (m 3
/s)
0
10
20
30
40
50
60
70
80
90
100
Precipitation (mm)
3B42RT Precipitation
Observed discharge
Discharge forced by 3B42RT
Bias = 20.37%
NSCE = 0.67
50N
40N
30N
20N
10N
EQ
10S
20S
30S
40S
50S
120W 90W
60W
30W
0
0
10
100 1,000 10,000 100,000
30E
60E
90E
120E
150E
180
FIGURE 15.5 (a) Example from the Goddard web site (http://oas.gsfc.nasa.gov/CREST/
global/) of global flood calculation from the CREST model in real time on June 11, 2010 at
0900 GMT. (b) Examples of hydrological model calibration and simulation over the period
2002–2006 using gauged and TRMM rainfall products in Nzoia Basin, Kenya, for the
SERVIR project.
Multiscale Hydrologic Remote Sensing: Perspectives and Applications
.gov/). GHM has been run on multiple years of TRMM precipitation data with the
averaged annual runoff (1999–2008) comparing well with GRDC gauge observations
(Hong et al. 2007b). It consistently performs well over the locations of 488 gauge stations
that represent 72% catchment coverage of actively discharging land surface (excluding
Antarctica, the glaciated portion of Greenland, and the Canadian Arctic Archipelago).
Since 2010, the second version of GHM, the distributed Coupled Routing and
Excess STorage (CREST) (Wang et al. 2011) hydrological model, has been jointly
developed by the University of Oklahoma (http://hydro.ou.edu) and NASA SERVIR
Project Team (http://www.servir.net). Shown in Figure 15.5a is an example of a realtime global flood prediction, at 1/8th degree latitude–longitude resolution, using a
(a)
(b)
0
200
400
600
800
1000
1200
1400
1/1/2002
1/1/2003
1/1/2004
1/1/2005
1/1/2006
Time series (d)
Stream flow (m 3 /s) 09Z11Jun2010
Discharge (m 3
/s)
0
10
20
30
40
50
60
70
80
90
100
Precipitation (mm)
3B42RT Precipitation
Observed discharge
Discharge forced by 3B42RT
Bias = 20.37%
NSCE = 0.67
50N
40N
30N
20N
10N
EQ
10S
20S
30S
40S
50S
120W 90W
60W
30W
0
0
10
100 1,000 10,000 100,000
30E
60E
90E
120E
150E
180
FIGURE 15.5 (a) Example from the Goddard web site (http://oas.gsfc.nasa.gov/CREST/
global/) of global flood calculation from the CREST model in real time on June 11, 2010 at
0900 GMT. (b) Examples of hydrological model calibration and simulation over the period
2002–2006 using gauged and TRMM rainfall products in Nzoia Basin, Kenya, for the
SERVIR project.