

379
Global Precipitation Estimation and Applications
gauge analysis, including the Climate Assessment and Monitoring System 0.5° ×
0.5° monthly gauge analysis and the Global GPCC 1.0° × 1.0° monthly gauge product. The monthly ratio of the satellite-only and satellite–gauge combination is used
to rescale the individual 3-hourly estimates. Therefore, the gauge-adjusted final
product, 3B42V6, has a nominal resolution of 3-hourly time steps and 0.25° × 0.25°
spatial resolution within the global latitude belt 50°S–N. More recently, Huffman
et al. (2007) have described how the 3B42RT product is scaled using the TRMM
Combined Instrument. Applying a bias correction without the need for monthly
gauge accumulations may have significant benefits for real-time users of rainfall
products, especially in ungauged basins (Figure 15.3).
Although estimates are provided at relatively fine scales (0.25° × 0.25°, 3-hourly)
in both real time and post real time to accommodate a wide range of researchers,
the most successful use of the TMPA data is when the analysis takes advantage of
the fine-scale data to create time/space averages appropriate to the user’s application. Huffman et al. (2010) also described that an upgrade for the research quality
Instantaneous
SSM/I
TRMM
AMSR
AMSU
30-Day HQ coefficients
Calibrate high-quality
(HQ) estimated to
“best”
Merge HQ estimates
Match IR and HQ,
generate coeffs
Apply IR coefficients
Merge IR, merged HQ
estimates
Compute monthly
satellite–gauge
combination (SG)
Rescale 3-hourly MS to
monthly SG
3-Hourly merged HQ
30-Day IR coefficients
Hourly HQ-calib IR
precip
3-Hourly multisatellite
(MS)
Monthly SG
Rescaled 3-hourly MS
3Hourly
IR Tb
Monthly
gauges
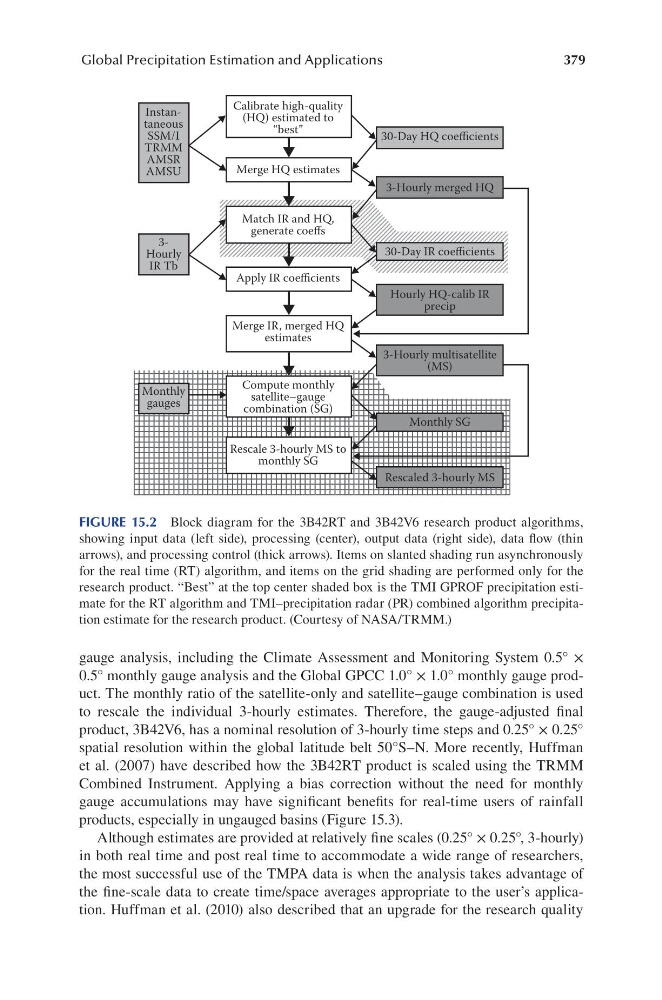
FIGURE 15.2 Block diagram for the 3B42RT and 3B42V6 research product algorithms,
showing input data (left side), processing (center), output data (right side), data flow (thin
arrows), and processing control (thick arrows). Items on slanted shading run asynchronously
for the real time (RT) algorithm, and items on the grid shading are performed only for the
research product. “Best” at the top center shaded box is the TMI GPROF precipitation estimate for the RT algorithm and TMI–precipitation radar (PR) combined algorithm precipitation estimate for the research product. (Courtesy of NASA/TRMM.)
Global Precipitation Estimation and Applications
gauge analysis, including the Climate Assessment and Monitoring System 0.5° ×
0.5° monthly gauge analysis and the Global GPCC 1.0° × 1.0° monthly gauge product. The monthly ratio of the satellite-only and satellite–gauge combination is used
to rescale the individual 3-hourly estimates. Therefore, the gauge-adjusted final
product, 3B42V6, has a nominal resolution of 3-hourly time steps and 0.25° × 0.25°
spatial resolution within the global latitude belt 50°S–N. More recently, Huffman
et al. (2007) have described how the 3B42RT product is scaled using the TRMM
Combined Instrument. Applying a bias correction without the need for monthly
gauge accumulations may have significant benefits for real-time users of rainfall
products, especially in ungauged basins (Figure 15.3).
Although estimates are provided at relatively fine scales (0.25° × 0.25°, 3-hourly)
in both real time and post real time to accommodate a wide range of researchers,
the most successful use of the TMPA data is when the analysis takes advantage of
the fine-scale data to create time/space averages appropriate to the user’s application. Huffman et al. (2010) also described that an upgrade for the research quality
Instantaneous
SSM/I
TRMM
AMSR
AMSU
30-Day HQ coefficients
Calibrate high-quality
(HQ) estimated to
“best”
Merge HQ estimates
Match IR and HQ,
generate coeffs
Apply IR coefficients
Merge IR, merged HQ
estimates
Compute monthly
satellite–gauge
combination (SG)
Rescale 3-hourly MS to
monthly SG
3-Hourly merged HQ
30-Day IR coefficients
Hourly HQ-calib IR
precip
3-Hourly multisatellite
(MS)
Monthly SG
Rescaled 3-hourly MS
3Hourly
IR Tb
Monthly
gauges
FIGURE 15.2 Block diagram for the 3B42RT and 3B42V6 research product algorithms,
showing input data (left side), processing (center), output data (right side), data flow (thin
arrows), and processing control (thick arrows). Items on slanted shading run asynchronously
for the real time (RT) algorithm, and items on the grid shading are performed only for the
research product. “Best” at the top center shaded box is the TMI GPROF precipitation estimate for the RT algorithm and TMI–precipitation radar (PR) combined algorithm precipitation estimate for the research product. (Courtesy of NASA/TRMM.)