

326
Multiscale Hydrologic Remote Sensing: Perspectives and Applications
distribution of the rainfall, which is useful for the spatial validation of radar rain
estimation.
The following case study presents the application of rain gauge for the validation of radar rain estimation. Rain gauge measurements from six sites of Oklahoma
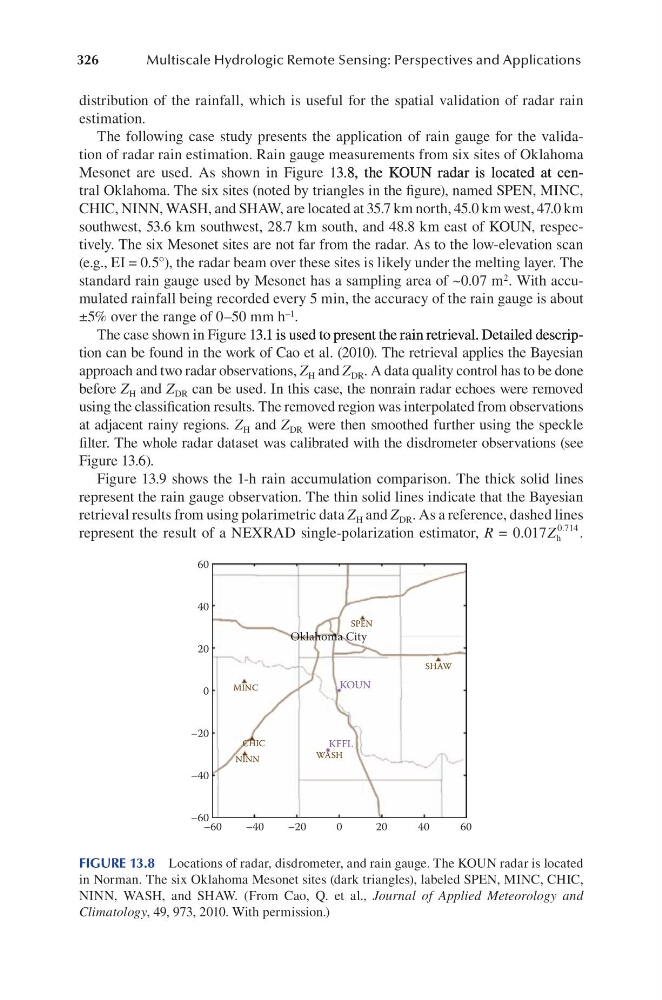
Mesonet are used. As shown in Figure 13.8, the KOUN radar is located at cen3.8, the KOUN radar is located at cen.8, the KOUN radar is located at central Oklahoma. The six sites (noted by triangles in the figure), named SPEN, MINC,
CHIC, NINN, WASH, and SHAW, are located at 35.7 km north, 45.0 km west, 47.0 km
southwest, 53.6 km southwest, 28.7 km south, and 48.8 km east of KOUN, respectively. The six Mesonet sites are not far from the radar. As to the low-elevation scan
(e.g., EI = 0.5°), the radar beam over these sites is likely under the melting layer. The
standard rain gauge used by Mesonet has a sampling area of ~0.07 m 2 . With accumulated rainfall being recorded every 5 min, the accuracy of the rain gauge is about
±5% over the range of 0–50 mm h –1 .
The case shown in Figure 13.1 is used to present the rain retrieval. Detailed descrip3.1 is used to present the rain retrieval. Detailed descrip.1 is used to present the rain retrieval. Detailed description can be found in the work of Cao et al. (2010). The retrieval applies the Bayesian
approach and two radar observations, Z H and Z DR . A data quality control has to be done
before Z H and Z DR can be used. In this case, the nonrain radar echoes were removed
using the classification results. The removed region was interpolated from observations
at adjacent rainy regions. Z H and Z DR were then smoothed further using the speckle
filter. The whole radar dataset was calibrated with the disdrometer observations (see
Figure 13.6).
Figure 13.9 shows the 1-h rain accumulation comparison. The thick solid lines
represent the rain gauge observation. The thin solid lines indicate that the Bayesian
retrieval results from using polarimetric data Z H and Z DR . As a reference, dashed lines
represent the result of a NEXRAD single-polarization estimator, R = 0 017
0 714
.
.
Z h .
60
40
20
0
–20
–40
–60
–60
–40
–20
0
Oklahoma City
20
40
60
MINC
SHAW
KOUN
KFFL
SPEN
WASH
NINN
CHIC
FIGURE 13.8 Locations of radar, disdrometer, and rain gauge. The KOUN radar is located
in Norman. The six Oklahoma Mesonet sites (dark triangles), labeled SPEN, MINC, CHIC,
NINN, WASH, and SHAW. (From Cao, Q. et al., Journal of Applied Meteorology and
Climatology, 49, 973, 2010. With permission.)
Multiscale Hydrologic Remote Sensing: Perspectives and Applications
distribution of the rainfall, which is useful for the spatial validation of radar rain
estimation.
The following case study presents the application of rain gauge for the validation of radar rain estimation. Rain gauge measurements from six sites of Oklahoma
Mesonet are used. As shown in Figure 13.8, the KOUN radar is located at cen3.8, the KOUN radar is located at cen.8, the KOUN radar is located at central Oklahoma. The six sites (noted by triangles in the figure), named SPEN, MINC,
CHIC, NINN, WASH, and SHAW, are located at 35.7 km north, 45.0 km west, 47.0 km
southwest, 53.6 km southwest, 28.7 km south, and 48.8 km east of KOUN, respectively. The six Mesonet sites are not far from the radar. As to the low-elevation scan
(e.g., EI = 0.5°), the radar beam over these sites is likely under the melting layer. The
standard rain gauge used by Mesonet has a sampling area of ~0.07 m 2 . With accumulated rainfall being recorded every 5 min, the accuracy of the rain gauge is about
±5% over the range of 0–50 mm h –1 .
The case shown in Figure 13.1 is used to present the rain retrieval. Detailed descrip3.1 is used to present the rain retrieval. Detailed descrip.1 is used to present the rain retrieval. Detailed description can be found in the work of Cao et al. (2010). The retrieval applies the Bayesian
approach and two radar observations, Z H and Z DR . A data quality control has to be done
before Z H and Z DR can be used. In this case, the nonrain radar echoes were removed
using the classification results. The removed region was interpolated from observations
at adjacent rainy regions. Z H and Z DR were then smoothed further using the speckle
filter. The whole radar dataset was calibrated with the disdrometer observations (see
Figure 13.6).
Figure 13.9 shows the 1-h rain accumulation comparison. The thick solid lines
represent the rain gauge observation. The thin solid lines indicate that the Bayesian
retrieval results from using polarimetric data Z H and Z DR . As a reference, dashed lines
represent the result of a NEXRAD single-polarization estimator, R = 0 017
0 714
.
.
Z h .
60
40
20
0
–20
–40
–60
–60
–40
–20
0
Oklahoma City
20
40
60
MINC
SHAW
KOUN
KFFL
SPEN
WASH
NINN
CHIC
FIGURE 13.8 Locations of radar, disdrometer, and rain gauge. The KOUN radar is located
in Norman. The six Oklahoma Mesonet sites (dark triangles), labeled SPEN, MINC, CHIC,
NINN, WASH, and SHAW. (From Cao, Q. et al., Journal of Applied Meteorology and
Climatology, 49, 973, 2010. With permission.)