

297
Precipitation Estimate Using NEXRAD Ground-Based Radar Images
TABLE 12.9
Percentage of Days That Different Prediction
Methods Perform Best in Terms of EB, r 2 , EE,
and rVar
NEXRAD
BA
RK
SKlm
EB
2.31%
48.20%
22.37%
34.78%
R 2
45.17%
3.17%
13.71%
43.00%
EE
9.38%
3.03%
11.26%
77.92%
RVar
21.93%
27.27%
42.14%
17.75%
Absolute EB
EE
RVar
R 2
1
0.8
0.6
0.4
0.2
0
3
2.5
2
1
1.5
0.5
80
60
40
20
0
1
0
–1
–2
–3
–4
NEXRAD
BA
RK
SKlm
NEXRAD
BA
RK
SKlm
NEXRAD
BA
RK
SKlm
NEXRAD
BA
RK
SKlm
(a)
(b)
(c)
(d)
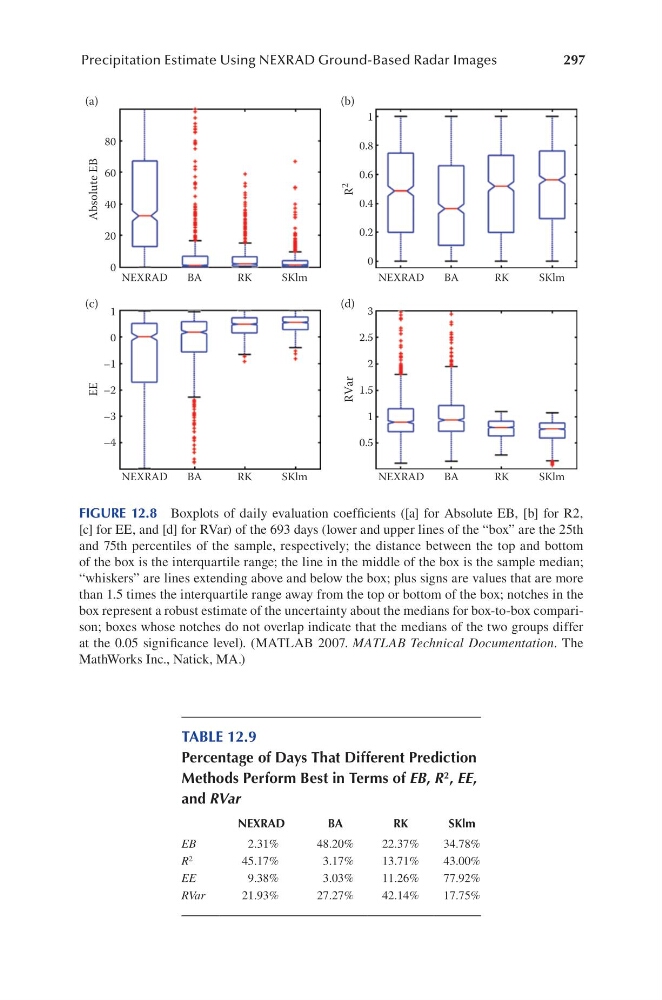
FIGURE 12.8 Boxplots of daily evaluation coefficients ([a] for Absolute EB, [b] for R2,
[c] for EE, and [d] for RVar) of the 693 days (lower and upper lines of the “box” are the 25th
and 75th percentiles of the sample, respectively; the distance between the top and bottom
of the box is the interquartile range; the line in the middle of the box is the sample median;
“whiskers” are lines extending above and below the box; plus signs are values that are more
than 1.5 times the interquartile range away from the top or bottom of the box; notches in the
box represent a robust estimate of the uncertainty about the medians for box-to-box comparison; boxes whose notches do not overlap indicate that the medians of the two groups differ
at the 0.05 significance level). (MATLAB 2007. MATLAB Technical Documentation. The
MathWorks Inc., Natick, MA.)
Precipitation Estimate Using NEXRAD Ground-Based Radar Images
TABLE 12.9
Percentage of Days That Different Prediction
Methods Perform Best in Terms of EB, r 2 , EE,
and rVar
NEXRAD
BA
RK
SKlm
EB
2.31%
48.20%
22.37%
34.78%
R 2
45.17%
3.17%
13.71%
43.00%
EE
9.38%
3.03%
11.26%
77.92%
RVar
21.93%
27.27%
42.14%
17.75%
Absolute EB
EE
RVar
R 2
1
0.8
0.6
0.4
0.2
0
3
2.5
2
1
1.5
0.5
80
60
40
20
0
1
0
–1
–2
–3
–4
NEXRAD
BA
RK
SKlm
NEXRAD
BA
RK
SKlm
NEXRAD
BA
RK
SKlm
NEXRAD
BA
RK
SKlm
(a)
(b)
(c)
(d)
FIGURE 12.8 Boxplots of daily evaluation coefficients ([a] for Absolute EB, [b] for R2,
[c] for EE, and [d] for RVar) of the 693 days (lower and upper lines of the “box” are the 25th
and 75th percentiles of the sample, respectively; the distance between the top and bottom
of the box is the interquartile range; the line in the middle of the box is the sample median;
“whiskers” are lines extending above and below the box; plus signs are values that are more
than 1.5 times the interquartile range away from the top or bottom of the box; notches in the
box represent a robust estimate of the uncertainty about the medians for box-to-box comparison; boxes whose notches do not overlap indicate that the medians of the two groups differ
at the 0.05 significance level). (MATLAB 2007. MATLAB Technical Documentation. The
MathWorks Inc., Natick, MA.)