

296
Multiscale Hydrologic Remote Sensing: Perspectives and Applications
assessment, SKlm and RK performed much better than BA for detecting rain presence, whereas BA slightly outperformed the other two methods for detecting no-rain
events. The highest success rate for detecting both rain presence and absence (D rain +
D no-rain ) obtained by SKlm indicates its superior detection capability to the other
methods. Compared with NEXRAD data, SKlm can improve the success detection
rate for both rain presence and nonpresence and the overall success rate (D rain +
D no-rain ) was improved from 178.4% to 183.52%. For the overall bias correction, the
three calibration techniques performed equally well. In terms of the other two evaluation coefficients, R 2 and EE, SKlm performed best. In comparison to NEXRAD
data, both RK and SKlm pronouncedly improved R 2 and EE. The overall assessment
results show that, among the three calibration techniques, SKlm performed best for
calibrating NEXRAD data using rain gauge data in this study area.
12.5.4.2 Performance Comparison for Daily Spatial Precipitation Prediction
Spatial precipitation maps are critical inputs for distributed hydrologic and ecological models. The capability of different calibration methods for spatial precipitation
prediction was evaluated using 693 days, with both rain gauge and NEXRAD areal
mean precipitation values larger than 0 because R 2 is not meaningful for zero areal
mean precipitation. For each day, four evaluation coefficients (EB, R 2 , EE, and RVar)
were calculated. Evaluation coefficients for different calibration techniques were
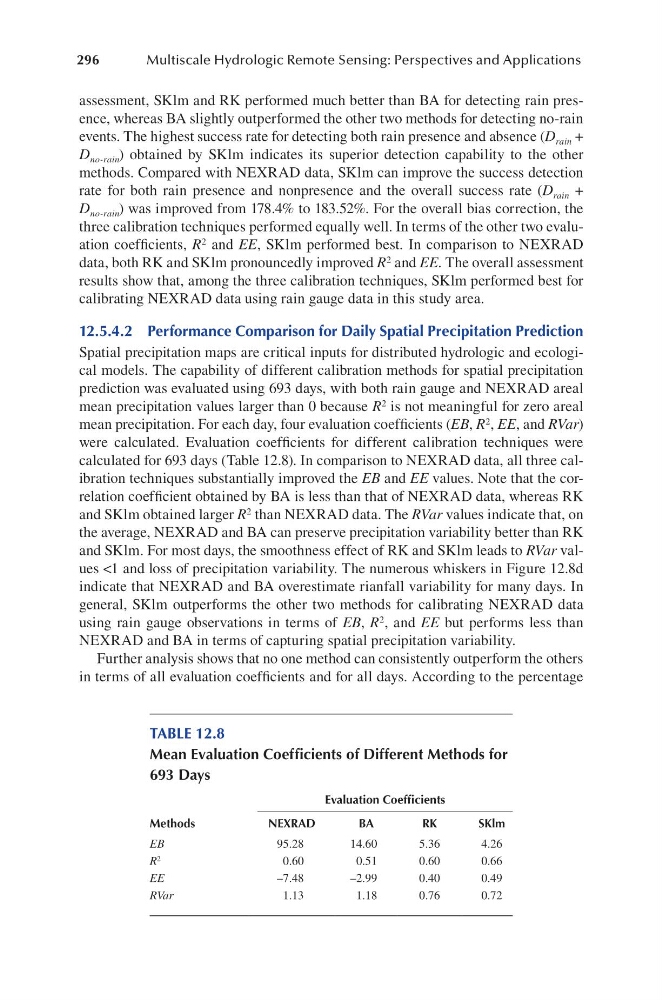
calculated for 693 days (Table 12.8). In comparison to NEXRAD data, all three calibration techniques substantially improved the EB and EE values. Note that the correlation coefficient obtained by BA is less than that of NEXRAD data, whereas RK
and SKlm obtained larger R 2 than NEXRAD data. The RVar values indicate that, on
the average, NEXRAD and BA can preserve precipitation variability better than RK
and SKlm. For most days, the smoothness effect of RK and SKlm leads to RVar values <1 and loss of precipitation variability. The numerous whiskers in Figure 12.8d
indicate that NEXRAD and BA overestimate rianfall variability for many days. In
general, SKlm outperforms the other two methods for calibrating NEXRAD data
using rain gauge observations in terms of EB, R 2 , and EE but performs less than
NEXRAD and BA in terms of capturing spatial precipitation variability.
Further analysis shows that no one method can consistently outperform the others
in terms of all evaluation coefficients and for all days. According to the percentage
TABLE 12.8
Mean Evaluation Coefficients of Different Methods for
693 Days
Methods
Evaluation Coefficients
NEXRAD
BA
RK
SKlm
EB
95.28
14.60
5.36
4.26
R 2
0.60
0.51
0.60
0.66
EE
–7.48
–2.99
0.40
0.49
RVar
1.13
1.18
0.76
0.72
Multiscale Hydrologic Remote Sensing: Perspectives and Applications
assessment, SKlm and RK performed much better than BA for detecting rain presence, whereas BA slightly outperformed the other two methods for detecting no-rain
events. The highest success rate for detecting both rain presence and absence (D rain +
D no-rain ) obtained by SKlm indicates its superior detection capability to the other
methods. Compared with NEXRAD data, SKlm can improve the success detection
rate for both rain presence and nonpresence and the overall success rate (D rain +
D no-rain ) was improved from 178.4% to 183.52%. For the overall bias correction, the
three calibration techniques performed equally well. In terms of the other two evaluation coefficients, R 2 and EE, SKlm performed best. In comparison to NEXRAD
data, both RK and SKlm pronouncedly improved R 2 and EE. The overall assessment
results show that, among the three calibration techniques, SKlm performed best for
calibrating NEXRAD data using rain gauge data in this study area.
12.5.4.2 Performance Comparison for Daily Spatial Precipitation Prediction
Spatial precipitation maps are critical inputs for distributed hydrologic and ecological models. The capability of different calibration methods for spatial precipitation
prediction was evaluated using 693 days, with both rain gauge and NEXRAD areal
mean precipitation values larger than 0 because R 2 is not meaningful for zero areal
mean precipitation. For each day, four evaluation coefficients (EB, R 2 , EE, and RVar)
were calculated. Evaluation coefficients for different calibration techniques were
calculated for 693 days (Table 12.8). In comparison to NEXRAD data, all three calibration techniques substantially improved the EB and EE values. Note that the correlation coefficient obtained by BA is less than that of NEXRAD data, whereas RK
and SKlm obtained larger R 2 than NEXRAD data. The RVar values indicate that, on
the average, NEXRAD and BA can preserve precipitation variability better than RK
and SKlm. For most days, the smoothness effect of RK and SKlm leads to RVar values <1 and loss of precipitation variability. The numerous whiskers in Figure 12.8d
indicate that NEXRAD and BA overestimate rianfall variability for many days. In
general, SKlm outperforms the other two methods for calibrating NEXRAD data
using rain gauge observations in terms of EB, R 2 , and EE but performs less than
NEXRAD and BA in terms of capturing spatial precipitation variability.
Further analysis shows that no one method can consistently outperform the others
in terms of all evaluation coefficients and for all days. According to the percentage
TABLE 12.8
Mean Evaluation Coefficients of Different Methods for
693 Days
Methods
Evaluation Coefficients
NEXRAD
BA
RK
SKlm
EB
95.28
14.60
5.36
4.26
R 2
0.60
0.51
0.60
0.66
EE
–7.48
–2.99
0.40
0.49
RVar
1.13
1.18
0.76
0.72