

286
Multiscale Hydrologic Remote Sensing: Perspectives and Applications
was obtained by aggregating hourly MPE NEXRAD data from http:// amazon.nws
.noaa.gov/hdsb/data/nexrad/nexrad.html and used to calculate D rain , D no-rain , EB, R 2 ,
and EE. Among these statistics, EB was calculated using accumulated precipitation depth, whereas the others were calculated from daily precipitation data. The
evaluation coefficients were calculated by using precipitation record collected from
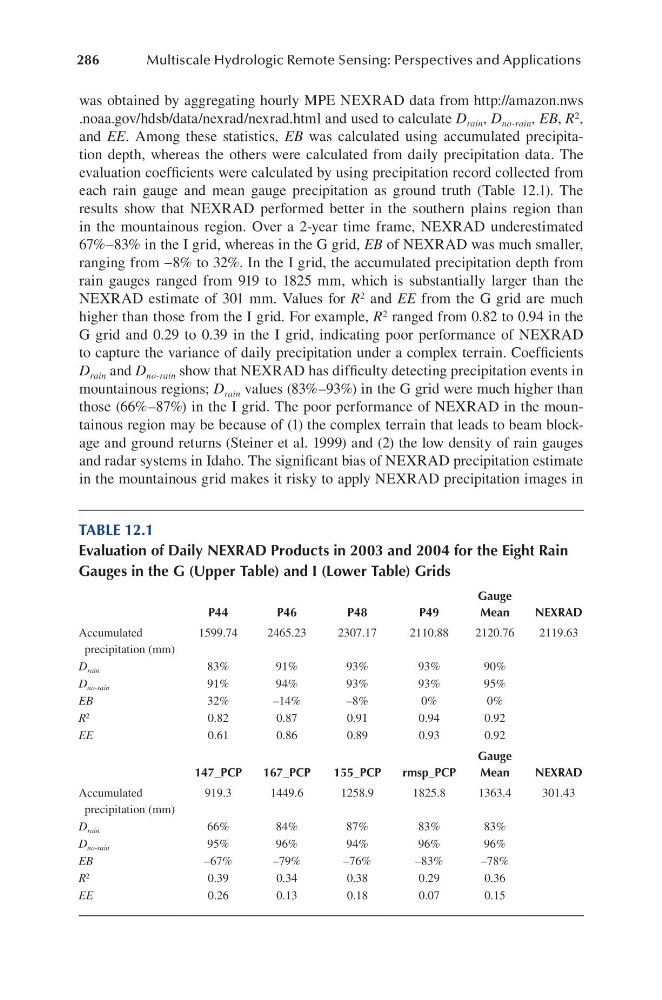
each rain gauge and mean gauge precipitation as ground truth (Table 12.1). The
results show that NEXRAD performed better in the southern plains region than
in the mountainous region. Over a 2-year time frame, NEXRAD underestimated
67%–83% in the I grid, whereas in the G grid, EB of NEXRAD was much smaller,
ranging from −8% to 32%. In the I grid, the accumulated precipitation depth from
rain gauges ranged from 919 to 1825 mm, which is substantially larger than the
NEXRAD estimate of 301 mm. Values for R 2 and EE from the G grid are much
higher than those from the I grid. For example, R 2 ranged from 0.82 to 0.94 in the
G grid and 0.29 to 0.39 in the I grid, indicating poor performance of NEXRAD
to capture the variance of daily precipitation under a complex terrain. Coefficients
D rain and D no-rain show that NEXRAD has difficulty detecting precipitation events in
mountainous regions; D rain values (83%–93%) in the G grid were much higher than
those (66%–87%) in the I grid. The poor performance of NEXRAD in the mountainous region may be because of (1) the complex terrain that leads to beam blockage and ground returns (Steiner et al. 1999) and (2) the low density of rain gauges
and radar systems in Idaho. The significant bias of NEXRAD precipitation estimate
in the mountainous grid makes it risky to apply NEXRAD precipitation images in
TABLE 12.1
Evaluation of Daily NEXRAD Products in 2003 and 2004 for the Eight Rain
Gauges in the G (Upper Table) and I (Lower Table) Grids
P44
P46
P48
P49
Gauge
Mean
NEXRAD
Accumulated
precipitation (mm)
1599.74
2465.23
2307.17
2110.88
2120.76
2119.63
D rain
83%
91%
93%
93%
90%
D no-rain
91%
94%
93%
93%
95%
EB
32%
–14%
–8%
0%
0%
R 2
0.82
0.87
0.91
0.94
0.92
EE
0.61
0.86
0.89
0.93
0.92
147_PCP
167_PCP
155_PCP
rmsp_PCP
Gauge
Mean
NEXRAD
Accumulated
precipitation (mm)
919.3
1449.6
1258.9
1825.8
1363.4
301.43
D rain
66%
84%
87%
83%
83%
D no-rain
95%
96%
94%
96%
96%
EB
–67%
–79%
–76%
–83%
–78%
R 2
0.39
0.34
0.38
0.29
0.36
EE
0.26
0.13
0.18
0.07
0.15
Multiscale Hydrologic Remote Sensing: Perspectives and Applications
was obtained by aggregating hourly MPE NEXRAD data from http:// amazon.nws
.noaa.gov/hdsb/data/nexrad/nexrad.html and used to calculate D rain , D no-rain , EB, R 2 ,
and EE. Among these statistics, EB was calculated using accumulated precipitation depth, whereas the others were calculated from daily precipitation data. The
evaluation coefficients were calculated by using precipitation record collected from
each rain gauge and mean gauge precipitation as ground truth (Table 12.1). The
results show that NEXRAD performed better in the southern plains region than
in the mountainous region. Over a 2-year time frame, NEXRAD underestimated
67%–83% in the I grid, whereas in the G grid, EB of NEXRAD was much smaller,
ranging from −8% to 32%. In the I grid, the accumulated precipitation depth from
rain gauges ranged from 919 to 1825 mm, which is substantially larger than the
NEXRAD estimate of 301 mm. Values for R 2 and EE from the G grid are much
higher than those from the I grid. For example, R 2 ranged from 0.82 to 0.94 in the
G grid and 0.29 to 0.39 in the I grid, indicating poor performance of NEXRAD
to capture the variance of daily precipitation under a complex terrain. Coefficients
D rain and D no-rain show that NEXRAD has difficulty detecting precipitation events in
mountainous regions; D rain values (83%–93%) in the G grid were much higher than
those (66%–87%) in the I grid. The poor performance of NEXRAD in the mountainous region may be because of (1) the complex terrain that leads to beam blockage and ground returns (Steiner et al. 1999) and (2) the low density of rain gauges
and radar systems in Idaho. The significant bias of NEXRAD precipitation estimate
in the mountainous grid makes it risky to apply NEXRAD precipitation images in
TABLE 12.1
Evaluation of Daily NEXRAD Products in 2003 and 2004 for the Eight Rain
Gauges in the G (Upper Table) and I (Lower Table) Grids
P44
P46
P48
P49
Gauge
Mean
NEXRAD
Accumulated
precipitation (mm)
1599.74
2465.23
2307.17
2110.88
2120.76
2119.63
D rain
83%
91%
93%
93%
90%
D no-rain
91%
94%
93%
93%
95%
EB
32%
–14%
–8%
0%
0%
R 2
0.82
0.87
0.91
0.94
0.92
EE
0.61
0.86
0.89
0.93
0.92
147_PCP
167_PCP
155_PCP
rmsp_PCP
Gauge
Mean
NEXRAD
Accumulated
precipitation (mm)
919.3
1449.6
1258.9
1825.8
1363.4
301.43
D rain
66%
84%
87%
83%
83%
D no-rain
95%
96%
94%
96%
96%
EB
–67%
–79%
–76%
–83%
–78%
R 2
0.39
0.34
0.38
0.29
0.36
EE
0.26
0.13
0.18
0.07
0.15