

285
Precipitation Estimate Using NEXRAD Ground-Based Radar Images
12.4 CASE STUDY 1: COMPARING NEXRAD PRECIPITATION
DATA WITH RAIN GAUGE OBSERVATIONS
Based on literature review, MPE was selected for NEXRAD performance evaluaon literature review, MPE was selected for NEXRAD performance evalualiterature review, MPE was selected for NEXRAD performance evaluation, because it is more reliable than Stage III and has been available since 2002 or
2003. Because most of the NWS cooperative observers have been used as a quality control on the NEXRAD MPE data (http://water.weather.gov/about.php), another
set of independent rain gauge observations is required to validate the performance
of NEXRAD data. Precipitation records from four rain gauges in the Little River
Experimental Watershed (LREW) in the southern plains region of Georgia (elevation about 200 m) and four rain gauges in Reynolds Creek Experimental Watershed
(RCEW) in the mountainous region of Idaho (elevation about 2000 m) were used in
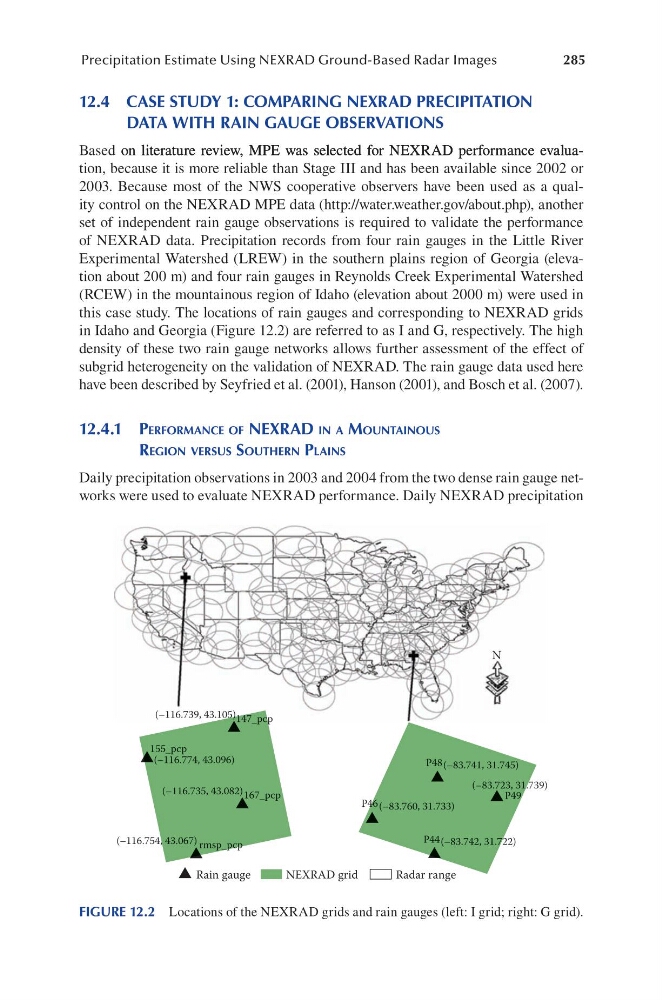
this case study. The locations of rain gauges and corresponding to NEXRAD grids
in Idaho and Georgia (Figure 12.2) are referred to as I and G, respectively. The high
density of these two rain gauge networks allows further assessment of the effect of
subgrid heterogeneity on the validation of NEXRAD. The rain gauge data used here
have been described by Seyfried et al. (2001), Hanson (2001), and Bosch et al. (2007).
12.4.1 PeRfoRMance of nexRad in a MountainouS
Region veRSuS SoutheRn PlainS
Daily precipitation observations in 2003 and 2004 from the two dense rain gauge networks were used to evaluate NEXRAD performance. Daily NEXRAD precipitation
(–116.739, 43.105)
(–116.774, 43.096)
(–116.735, 43.082)
(–83.741, 31.745)
(–83.723, 31.739)
(–83.742, 31.722)
(–83.760, 31.733)
(–116.754, 43.067)
147_pcp
P48
P46
P49
P44
167_pcp
rmsp_pcp
155_pcp
Rain gauge
NEXRAD grid
Radar range
N
FIGURE 12.2 Locations of the NEXRAD grids and rain gauges (left: I grid; right: G grid).
Precipitation Estimate Using NEXRAD Ground-Based Radar Images
12.4 CASE STUDY 1: COMPARING NEXRAD PRECIPITATION
DATA WITH RAIN GAUGE OBSERVATIONS
Based on literature review, MPE was selected for NEXRAD performance evaluaon literature review, MPE was selected for NEXRAD performance evalualiterature review, MPE was selected for NEXRAD performance evaluation, because it is more reliable than Stage III and has been available since 2002 or
2003. Because most of the NWS cooperative observers have been used as a quality control on the NEXRAD MPE data (http://water.weather.gov/about.php), another
set of independent rain gauge observations is required to validate the performance
of NEXRAD data. Precipitation records from four rain gauges in the Little River
Experimental Watershed (LREW) in the southern plains region of Georgia (elevation about 200 m) and four rain gauges in Reynolds Creek Experimental Watershed
(RCEW) in the mountainous region of Idaho (elevation about 2000 m) were used in
this case study. The locations of rain gauges and corresponding to NEXRAD grids
in Idaho and Georgia (Figure 12.2) are referred to as I and G, respectively. The high
density of these two rain gauge networks allows further assessment of the effect of
subgrid heterogeneity on the validation of NEXRAD. The rain gauge data used here
have been described by Seyfried et al. (2001), Hanson (2001), and Bosch et al. (2007).
12.4.1 PeRfoRMance of nexRad in a MountainouS
Region veRSuS SoutheRn PlainS
Daily precipitation observations in 2003 and 2004 from the two dense rain gauge networks were used to evaluate NEXRAD performance. Daily NEXRAD precipitation
(–116.739, 43.105)
(–116.774, 43.096)
(–116.735, 43.082)
(–83.741, 31.745)
(–83.723, 31.739)
(–83.742, 31.722)
(–83.760, 31.733)
(–116.754, 43.067)
147_pcp
P48
P46
P49
P44
167_pcp
rmsp_pcp
155_pcp
Rain gauge
NEXRAD grid
Radar range
N
FIGURE 12.2 Locations of the NEXRAD grids and rain gauges (left: I grid; right: G grid).