

255
Multispectral Satellite Data for Flood Monitoring and Inundation Mapping
11.2.2.1 Model Calibration and Validation
The CREST model was calibrated using available daily observed discharge data
for the period between 1998 and 2004. A 1-year period (1998) was used for warming up the model states. The model utilizes a global optimization approach to
capture the parameter interactions. An autocalibration technique based on the
adaptive random search (ARS) method (Brooks 1958) was used to calibrate the
CREST model. The ARS method is considered adaptive in the sense that it uses
information gathered during previous iterations to decide how simulation efforts
are expended in the current iteration. The two most commonly used indicators for
the model calibration, in order to get the best match of model-simulated streamflow with observations, are the Nash–Sutcliffe coefficient of efficiency (NSCE;
Nash and Sutcliffe 1970) and relative bias ratio (Bias). These two criteria were used
as objective functions for the automatic calibration in such a global optimization
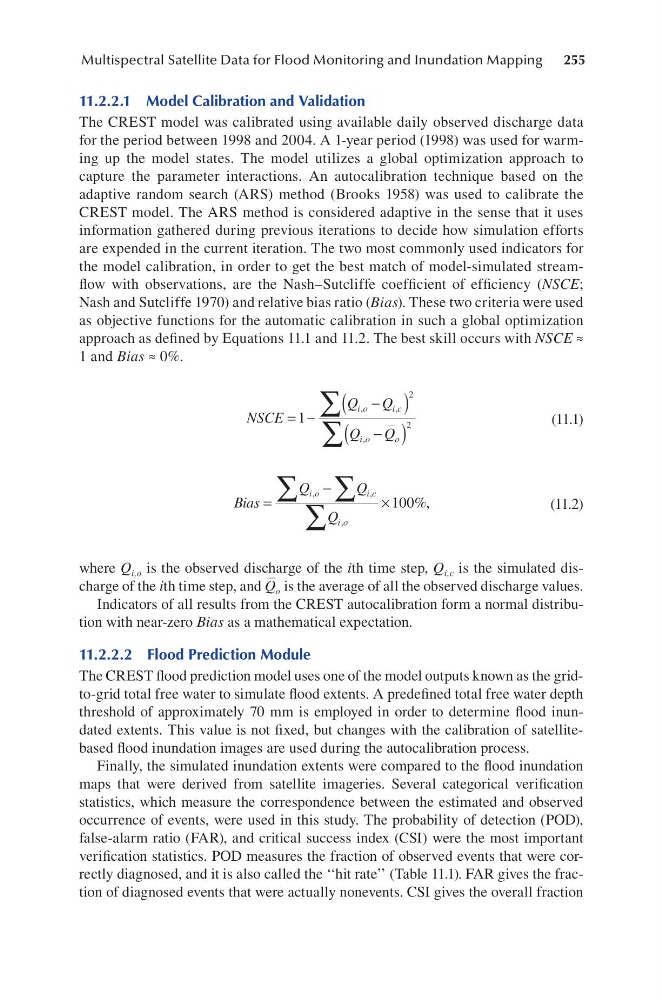
approach as defined by Equations 11.1 and 11.2. The best skill occurs with NSCE ≈
1 and Bias ≈ 0%.
NSCE
Q
Q
Q
Q
i o
i c
i o
o
= −
−
(
)
−
(
)
∑
∑
1
2
2
,
,
,
(11.1)
Bias
Q
Q
Q
i o
i c
i o
=
−
×
∑ ∑
∑
,
,
,
%,
100
(11.2)
where Q i,o is the observed discharge of the ith time step, Q i,c is the simulated discharge of the ith time step, and Q o is the average of all the observed discharge values.
Indicators of all results from the CREST autocalibration form a normal distribution with near-zero Bias as a mathematical expectation.
11.2.2.2 Flood Prediction Module
The CREST flood prediction model uses one of the model outputs known as the gridto-grid total free water to simulate flood extents. A predefined total free water depth
threshold of approximately 70 mm is employed in order to determine flood inundated extents. This value is not fixed, but changes with the calibration of satellitebased flood inundation images are used during the autocalibration process.
Finally, the simulated inundation extents were compared to the flood inundation
maps that were derived from satellite imageries. Several categorical verification
statistics, which measure the correspondence between the estimated and observed
occurrence of events, were used in this study. The probability of detection (POD),
false-alarm ratio (FAR), and critical success index (CSI) were the most important
verification statistics. POD measures the fraction of observed events that were correctly diagnosed, and it is also called the ‘‘hit rate’’ (Table 11.1). FAR gives the fraction of diagnosed events that were actually nonevents. CSI gives the overall fraction
Multispectral Satellite Data for Flood Monitoring and Inundation Mapping
11.2.2.1 Model Calibration and Validation
The CREST model was calibrated using available daily observed discharge data
for the period between 1998 and 2004. A 1-year period (1998) was used for warming up the model states. The model utilizes a global optimization approach to
capture the parameter interactions. An autocalibration technique based on the
adaptive random search (ARS) method (Brooks 1958) was used to calibrate the
CREST model. The ARS method is considered adaptive in the sense that it uses
information gathered during previous iterations to decide how simulation efforts
are expended in the current iteration. The two most commonly used indicators for
the model calibration, in order to get the best match of model-simulated streamflow with observations, are the Nash–Sutcliffe coefficient of efficiency (NSCE;
Nash and Sutcliffe 1970) and relative bias ratio (Bias). These two criteria were used
as objective functions for the automatic calibration in such a global optimization
approach as defined by Equations 11.1 and 11.2. The best skill occurs with NSCE ≈
1 and Bias ≈ 0%.
NSCE
Q
Q
Q
Q
i o
i c
i o
o
= −
−
(
)
−
(
)
∑
∑
1
2
2
,
,
,
(11.1)
Bias
Q
Q
Q
i o
i c
i o
=
−
×
∑ ∑
∑
,
,
,
%,
100
(11.2)
where Q i,o is the observed discharge of the ith time step, Q i,c is the simulated discharge of the ith time step, and Q o is the average of all the observed discharge values.
Indicators of all results from the CREST autocalibration form a normal distribution with near-zero Bias as a mathematical expectation.
11.2.2.2 Flood Prediction Module
The CREST flood prediction model uses one of the model outputs known as the gridto-grid total free water to simulate flood extents. A predefined total free water depth
threshold of approximately 70 mm is employed in order to determine flood inundated extents. This value is not fixed, but changes with the calibration of satellitebased flood inundation images are used during the autocalibration process.
Finally, the simulated inundation extents were compared to the flood inundation
maps that were derived from satellite imageries. Several categorical verification
statistics, which measure the correspondence between the estimated and observed
occurrence of events, were used in this study. The probability of detection (POD),
false-alarm ratio (FAR), and critical success index (CSI) were the most important
verification statistics. POD measures the fraction of observed events that were correctly diagnosed, and it is also called the ‘‘hit rate’’ (Table 11.1). FAR gives the fraction of diagnosed events that were actually nonevents. CSI gives the overall fraction