

241
Modeling Snowmelt Runoff under Climate Change Scenarios
set, and then averaging the results for each day of the water year over the 24-year
period.
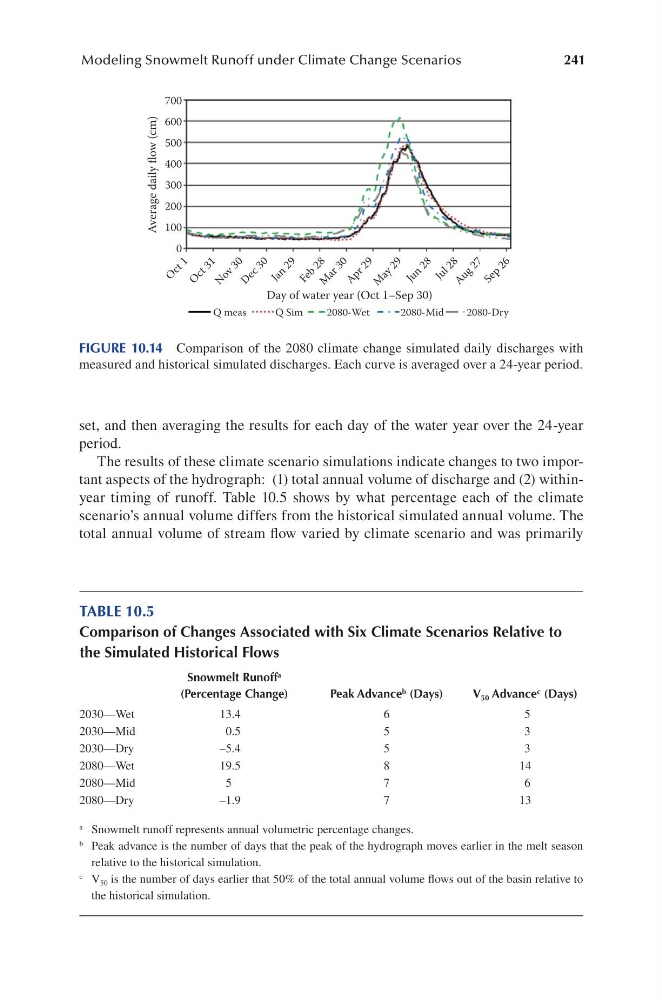
The results of these climate scenario simulations indicate changes to two important aspects of the hydrograph: (1) total annual volume of discharge and (2) withinyear timing of runoff. Table 10.5 shows by what percentage each of the climate
scenario’s annual volume differs from the historical simulated annual volume. The
total annual volume of stream flow varied by climate scenario and was primarily
700
600
500
400
300
200
100
0
Q meas
Q Sim
2080-Wet
2080-Mid
2080-Dry
O
c t 1
O
c t 3 1
N
o v 3 0
D
e c 3 0
J a n
2 9
F e b
2 8 M
a r 3 0
A p r 2 9
M
a y 2 9
J u n
2 8
J u l 2 8 A u g
2 7
S e p
2 6
Day of water year (Oct 1–Sep 30)
Average daily flow (cm)
FIGURE 10.14 Comparison of the 2080 climate change simulated daily discharges with
measured and historical simulated discharges. Each curve is averaged over a 24-year period.
TABLE 10.5
Comparison of Changes Associated with Six Climate Scenarios Relative to
the Simulated Historical Flows
Snowmelt Runoff a
(Percentage Change)
Peak Advance b (Days)
V 50 Advance c (Days)
2030—Wet
13.4
6
5
2030—Mid
0.5
5
3
2030—Dry
–5.4
5
3
2080—Wet
19.5
8
14
2080—Mid
5
7
6
2080—Dry
–1.9
7
13
a Snowmelt runoff represents annual volumetric percentage changes.
b Peak advance is the number of days that the peak of the hydrograph moves earlier in the melt season
relative to the historical simulation.
c V 50 is the number of days earlier that 50% of the total annual volume flows out of the basin relative to
the historical simulation.
Modeling Snowmelt Runoff under Climate Change Scenarios
set, and then averaging the results for each day of the water year over the 24-year
period.
The results of these climate scenario simulations indicate changes to two important aspects of the hydrograph: (1) total annual volume of discharge and (2) withinyear timing of runoff. Table 10.5 shows by what percentage each of the climate
scenario’s annual volume differs from the historical simulated annual volume. The
total annual volume of stream flow varied by climate scenario and was primarily
700
600
500
400
300
200
100
0
Q meas
Q Sim
2080-Wet
2080-Mid
2080-Dry
O
c t 1
O
c t 3 1
N
o v 3 0
D
e c 3 0
J a n
2 9
F e b
2 8 M
a r 3 0
A p r 2 9
M
a y 2 9
J u n
2 8
J u l 2 8 A u g
2 7
S e p
2 6
Day of water year (Oct 1–Sep 30)
Average daily flow (cm)
FIGURE 10.14 Comparison of the 2080 climate change simulated daily discharges with
measured and historical simulated discharges. Each curve is averaged over a 24-year period.
TABLE 10.5
Comparison of Changes Associated with Six Climate Scenarios Relative to
the Simulated Historical Flows
Snowmelt Runoff a
(Percentage Change)
Peak Advance b (Days)
V 50 Advance c (Days)
2030—Wet
13.4
6
5
2030—Mid
0.5
5
3
2030—Dry
–5.4
5
3
2080—Wet
19.5
8
14
2080—Mid
5
7
6
2080—Dry
–1.9
7
13
a Snowmelt runoff represents annual volumetric percentage changes.
b Peak advance is the number of days that the peak of the hydrograph moves earlier in the melt season
relative to the historical simulation.
c V 50 is the number of days earlier that 50% of the total annual volume flows out of the basin relative to
the historical simulation.