

235
Modeling Snowmelt Runoff under Climate Change Scenarios
assigning the value of snow cover fraction at melt-out to each SNOTEL station by
means of the 2003 MODIS data, the MODIS data and SNOTEL data in Figures 10.8
through 10.10 are independent. In other words, the good agreement is entirely due
to the year-to-year similarity in the spatial pattern of melt out, and that both MODIS
and the SNOTEL stations capture this phenomenon.
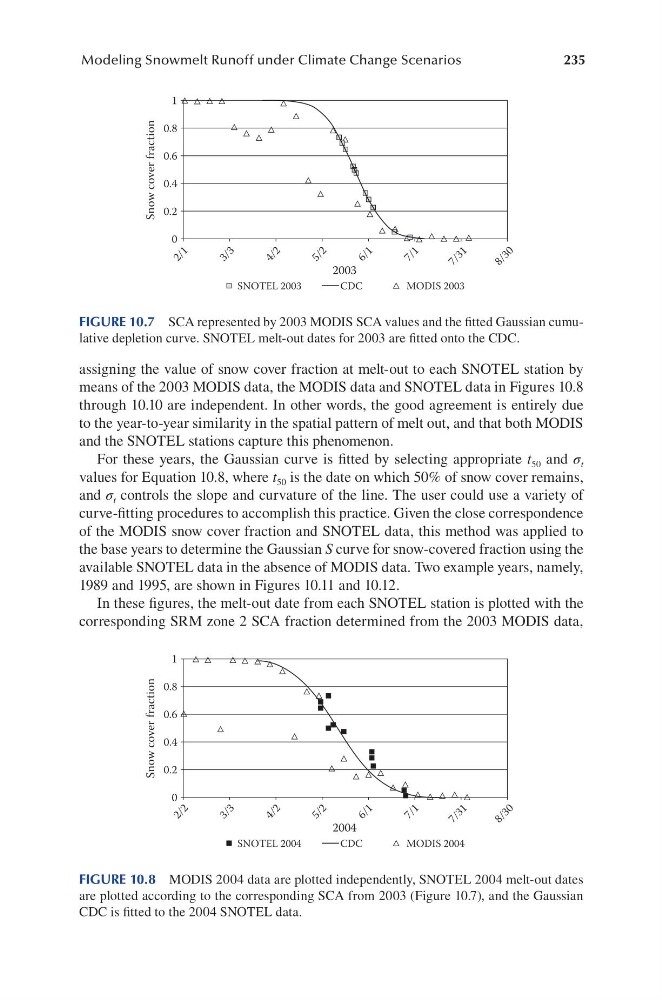
For these years, the Gaussian curve is fitted by selecting appropriate t 50 and σ t
values for Equation 10.8, where t 50 is the date on which 50% of snow cover remains,
and σ t controls the slope and curvature of the line. The user could use a variety of
curve-fitting procedures to accomplish this practice. Given the close correspondence
of the MODIS snow cover fraction and SNOTEL data, this method was applied to
the base years to determine the Gaussian S curve for snow-covered fraction using the
available SNOTEL data in the absence of MODIS data. Two example years, namely,
1989 and 1995, are shown in Figures 10.11 and 10.12.
In these figures, the melt-out date from each SNOTEL station is plotted with the
corresponding SRM zone 2 SCA fraction determined from the 2003 MODIS data,
1
0.8
0.6
0.4
Snow cover fraction
0.2
0
2 / 1
3 / 3
4 / 2
5 / 2
6 / 1
7 / 1
7 / 3 1
8 / 3 0
2003
SNOTEL 2003
CDC
MODIS 2003
FIGURE 10.7 SCA represented by 2003 MODIS SCA values and the fitted Gaussian cumulative depletion curve. SNOTEL melt-out dates for 2003 are fitted onto the CDC.
1
0.8
0.6
0.4
Snow cover fraction
0.2
0
2 / 2
3 / 3
4 / 2
5 / 2
6 / 1
7 / 1
7 / 3 1
8 / 3 0
2004
SNOTEL 2004
CDC
MODIS 2004
FIGURE 10.8 MODIS 2004 data are plotted independently, SNOTEL 2004 melt-out dates
are plotted according to the corresponding SCA from 2003 (Figure 10.7), and the Gaussian
CDC is fitted to the 2004 SNOTEL data.
Modeling Snowmelt Runoff under Climate Change Scenarios
assigning the value of snow cover fraction at melt-out to each SNOTEL station by
means of the 2003 MODIS data, the MODIS data and SNOTEL data in Figures 10.8
through 10.10 are independent. In other words, the good agreement is entirely due
to the year-to-year similarity in the spatial pattern of melt out, and that both MODIS
and the SNOTEL stations capture this phenomenon.
For these years, the Gaussian curve is fitted by selecting appropriate t 50 and σ t
values for Equation 10.8, where t 50 is the date on which 50% of snow cover remains,
and σ t controls the slope and curvature of the line. The user could use a variety of
curve-fitting procedures to accomplish this practice. Given the close correspondence
of the MODIS snow cover fraction and SNOTEL data, this method was applied to
the base years to determine the Gaussian S curve for snow-covered fraction using the
available SNOTEL data in the absence of MODIS data. Two example years, namely,
1989 and 1995, are shown in Figures 10.11 and 10.12.
In these figures, the melt-out date from each SNOTEL station is plotted with the
corresponding SRM zone 2 SCA fraction determined from the 2003 MODIS data,
1
0.8
0.6
0.4
Snow cover fraction
0.2
0
2 / 1
3 / 3
4 / 2
5 / 2
6 / 1
7 / 1
7 / 3 1
8 / 3 0
2003
SNOTEL 2003
CDC
MODIS 2003
FIGURE 10.7 SCA represented by 2003 MODIS SCA values and the fitted Gaussian cumulative depletion curve. SNOTEL melt-out dates for 2003 are fitted onto the CDC.
1
0.8
0.6
0.4
Snow cover fraction
0.2
0
2 / 2
3 / 3
4 / 2
5 / 2
6 / 1
7 / 1
7 / 3 1
8 / 3 0
2004
SNOTEL 2004
CDC
MODIS 2004
FIGURE 10.8 MODIS 2004 data are plotted independently, SNOTEL 2004 melt-out dates
are plotted according to the corresponding SCA from 2003 (Figure 10.7), and the Gaussian
CDC is fitted to the 2004 SNOTEL data.