

145
Remote Sensing Drought Assessment in a Coastal Urban Region
for all bands, including the thermal band. The root mean square error of rectification
was less than 0.5 in this study.
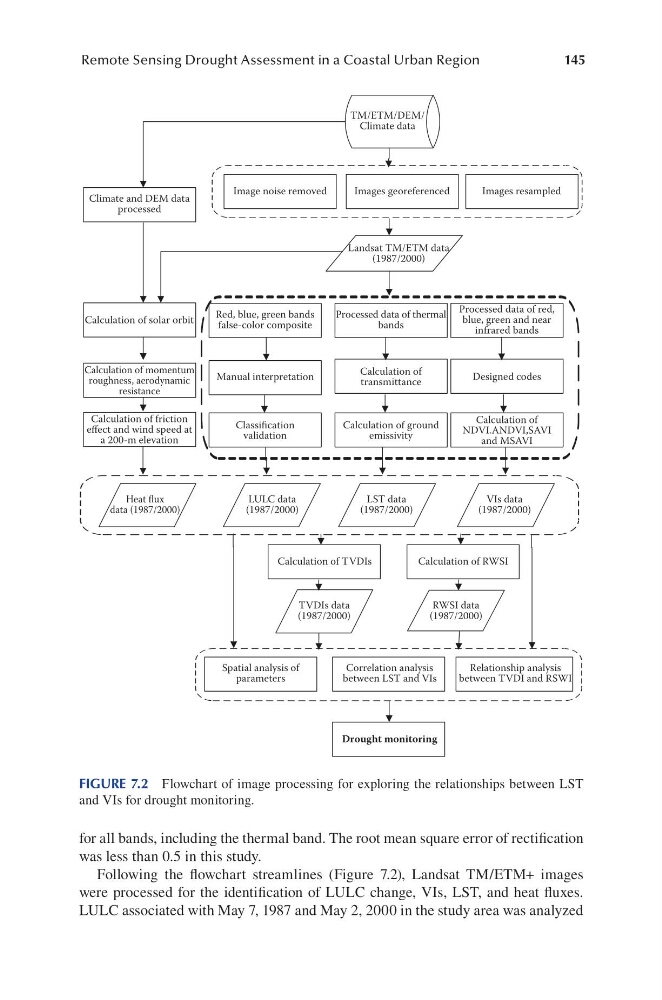
Following the flowchart streamlines (Figure 7.2), Landsat TM/ETM+ images
were processed for the identification of LULC change, VIs, LST, and heat fluxes.
LULC associated with May 7, 1987 and May 2, 2000 in the study area was analyzed
TM/ETM/DEM/
Climate data
Climate and DEM data
processed
Calculation of solar orbit
Red, blue, green bands
false-color composite
Processed data of thermal
bands
Processed data of red,
blue, green and near
infrared bands
Designed codes
Calculation of
transmittance
Calculation of TVDIs
Calculation of RWSI
Spatial analysis of
parameters
Correlation analysis
between LST and VIs
Relationship analysis
between TVDI and RSWI
Drought monitoring
Calculation of ground
emissivity
Calculation of
NDVI.ANDVI,SAVI
and MSAVI
Manual interpretation
Classification
validation
Calculation of momentum
roughness, aerodynamic
resistance
Calculation of friction
effect and wind speed at
a 200-m elevation
Heat flux
data (1987/2000)
LULC data
(1987/2000)
LST data
(1987/2000)
VIs data
(1987/2000)
TVDIs data
(1987/2000)
RWSI data
(1987/2000)
Image noise removed
Images georeferenced
Images resampled
Landsat TM/ETM data
(1987/2000)
FIGURE 7.2 Flowchart of image processing for exploring the relationships between LST
and VIs for drought monitoring.
Remote Sensing Drought Assessment in a Coastal Urban Region
for all bands, including the thermal band. The root mean square error of rectification
was less than 0.5 in this study.
Following the flowchart streamlines (Figure 7.2), Landsat TM/ETM+ images
were processed for the identification of LULC change, VIs, LST, and heat fluxes.
LULC associated with May 7, 1987 and May 2, 2000 in the study area was analyzed
TM/ETM/DEM/
Climate data
Climate and DEM data
processed
Calculation of solar orbit
Red, blue, green bands
false-color composite
Processed data of thermal
bands
Processed data of red,
blue, green and near
infrared bands
Designed codes
Calculation of
transmittance
Calculation of TVDIs
Calculation of RWSI
Spatial analysis of
parameters
Correlation analysis
between LST and VIs
Relationship analysis
between TVDI and RSWI
Drought monitoring
Calculation of ground
emissivity
Calculation of
NDVI.ANDVI,SAVI
and MSAVI
Manual interpretation
Classification
validation
Calculation of momentum
roughness, aerodynamic
resistance
Calculation of friction
effect and wind speed at
a 200-m elevation
Heat flux
data (1987/2000)
LULC data
(1987/2000)
LST data
(1987/2000)
VIs data
(1987/2000)
TVDIs data
(1987/2000)
RWSI data
(1987/2000)
Image noise removed
Images georeferenced
Images resampled
Landsat TM/ETM data
(1987/2000)
FIGURE 7.2 Flowchart of image processing for exploring the relationships between LST
and VIs for drought monitoring.