

105
Thermal Radiation and Energy Closure Assessment
The u spectra for the same day and time period are presented in Figure 5.10b.
Here, we observed two distinct peaks: first in the low-frequency range with a peak
at approximately 0.005 and the second much broader peak from 0.02 to 0.2. The
broad spectral peak suggests the presence of an inner layer scaling turbulence that
is a result of processes caused by the effects of surface friction. The larger peak in
the low frequency is a result of outer layer scaling resulting from large-scale motions
in the convective boundary layer with a length scale corresponding to the height of
the local inversion base at the top of the convective boundary layer. These eddies
are passing overhead at a speed set by the mean wind velocity (McNaughton and
Laubach 2000).
The concept of inner and outer layer scaling was proposed by Townsend (1961),
but for momentum transport, it was extended to include scalar admixtures (Bradshaw
1967; Högström 1990; Katul et al. 1996, 1998; Raupach et al. 1991). This concept
brought an understanding about how low-frequency scales of eddies interact with
high-frequency scales at a surface to consequently increase the challenge of interpreting turbulent fluxes at a local surface. This was necessary because of intruding
scales of motions that bring to the surface layer scalars and mass, which are often
outside the local footprint of the surface. In semiarid regions where irrigation is the
primary source of water, ET processes are routinely affected by these types of scaling motions.
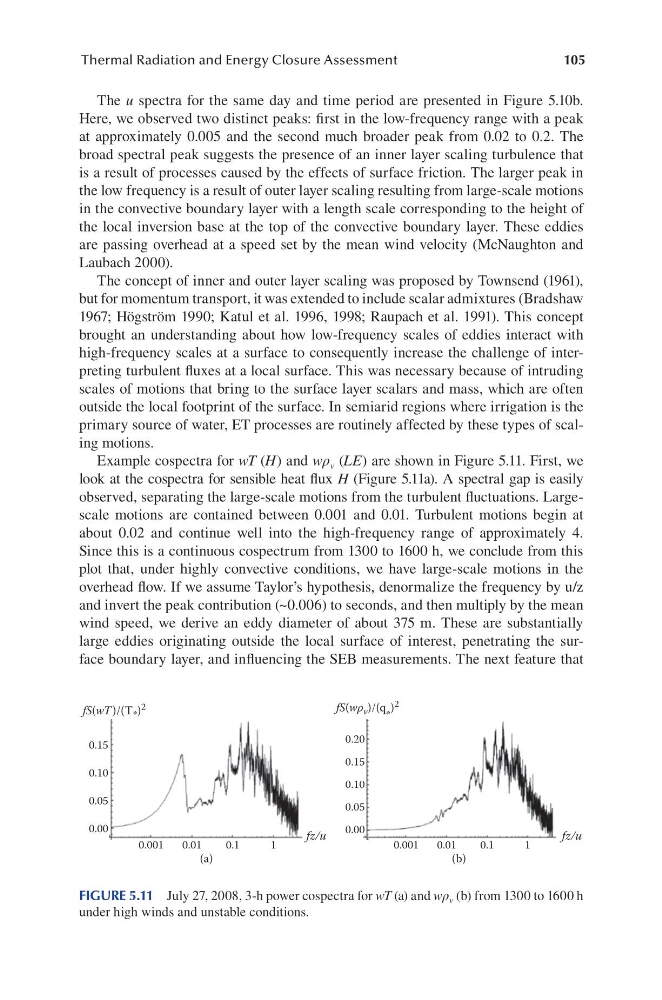
Example cospectra for wT (H) and wρ v (LE) are shown in Figure 5.11. First, we
look at the cospectra for sensible heat flux H (Figure 5.11a). A spectral gap is easily
observed, separating the large-scale motions from the turbulent fluctuations. Largescale motions are contained between 0.001 and 0.01. Turbulent motions begin at
about 0.02 and continue well into the high-frequency range of approximately 4.
Since this is a continuous cospectrum from 1300 to 1600 h, we conclude from this
plot that, under highly convective conditions, we have large-scale motions in the
overhead flow. If we assume Taylor’s hypothesis, denormalize the frequency by u/z
and invert the peak contribution (~0.006) to seconds, and then multiply by the mean
wind speed, we derive an eddy diameter of about 375 m. These are substantially
large eddies originating outside the local surface of interest, penetrating the surface boundary layer, and influencing the SEB measurements. The next feature that
0.15
fS(wT )/(T * ) 2
fS(wρ v )/(q *
) 2
fz/u
fz/u
0.10
0.20
0.15
0.10
0.05
0.00
0.05
0.00
0.001
0.01
0.1
1
0.001
0.01
0.1
1
(a)
(b)
FIGURE 5.11 July 27, 2008, 3-h power cospectra for wT (a) and wρ v (b) from 1300 to 1600 h
under high winds and unstable conditions.
Thermal Radiation and Energy Closure Assessment
The u spectra for the same day and time period are presented in Figure 5.10b.
Here, we observed two distinct peaks: first in the low-frequency range with a peak
at approximately 0.005 and the second much broader peak from 0.02 to 0.2. The
broad spectral peak suggests the presence of an inner layer scaling turbulence that
is a result of processes caused by the effects of surface friction. The larger peak in
the low frequency is a result of outer layer scaling resulting from large-scale motions
in the convective boundary layer with a length scale corresponding to the height of
the local inversion base at the top of the convective boundary layer. These eddies
are passing overhead at a speed set by the mean wind velocity (McNaughton and
Laubach 2000).
The concept of inner and outer layer scaling was proposed by Townsend (1961),
but for momentum transport, it was extended to include scalar admixtures (Bradshaw
1967; Högström 1990; Katul et al. 1996, 1998; Raupach et al. 1991). This concept
brought an understanding about how low-frequency scales of eddies interact with
high-frequency scales at a surface to consequently increase the challenge of interpreting turbulent fluxes at a local surface. This was necessary because of intruding
scales of motions that bring to the surface layer scalars and mass, which are often
outside the local footprint of the surface. In semiarid regions where irrigation is the
primary source of water, ET processes are routinely affected by these types of scaling motions.
Example cospectra for wT (H) and wρ v (LE) are shown in Figure 5.11. First, we
look at the cospectra for sensible heat flux H (Figure 5.11a). A spectral gap is easily
observed, separating the large-scale motions from the turbulent fluctuations. Largescale motions are contained between 0.001 and 0.01. Turbulent motions begin at
about 0.02 and continue well into the high-frequency range of approximately 4.
Since this is a continuous cospectrum from 1300 to 1600 h, we conclude from this
plot that, under highly convective conditions, we have large-scale motions in the
overhead flow. If we assume Taylor’s hypothesis, denormalize the frequency by u/z
and invert the peak contribution (~0.006) to seconds, and then multiply by the mean
wind speed, we derive an eddy diameter of about 375 m. These are substantially
large eddies originating outside the local surface of interest, penetrating the surface boundary layer, and influencing the SEB measurements. The next feature that
0.15
fS(wT )/(T * ) 2
fS(wρ v )/(q *
) 2
fz/u
fz/u
0.10
0.20
0.15
0.10
0.05
0.00
0.05
0.00
0.001
0.01
0.1
1
0.001
0.01
0.1
1
(a)
(b)
FIGURE 5.11 July 27, 2008, 3-h power cospectra for wT (a) and wρ v (b) from 1300 to 1600 h
under high winds and unstable conditions.