

104
Multiscale Hydrologic Remote Sensing: Perspectives and Applications
eddies moving past the EC system. The large low-frequency trend (30 min) is radiation driven, but shorter and oscillatory bursts are a turbulence-driven process involving low- and high-frequency turbulence.
Overall, in this study, we had not yet completed the closure evaluation for the
entire season, but we had evaluated the closure ranges for the selected days and
found a range of closure values from 0.75 to 0.92. These closure values are typical of
those reported by other studies in semiarid environments (Prueger et al. 1996, 2004;
Kalthoff et al. 2006; Xiao et al. 2011).
We may then look at an example power spectrum during the afternoon period
from 1300 to 1600h on 27 July 2008. First, it should be noted that, for all power,
the x-axis values are normalized with height of the measurement z and mean wind
speed u (not to be mistaken with instantaneous u). The spectra (y-axis values) were
normalized with the friction velocity (u * ) and the natural frequency ( f ). Cospectra
are normalized in the same way for the x-axis values, whereas the y-axis values are
normalized by temperature and humidity scales defined as θ * = H/u * and q * = LE/u * ,
respectively.
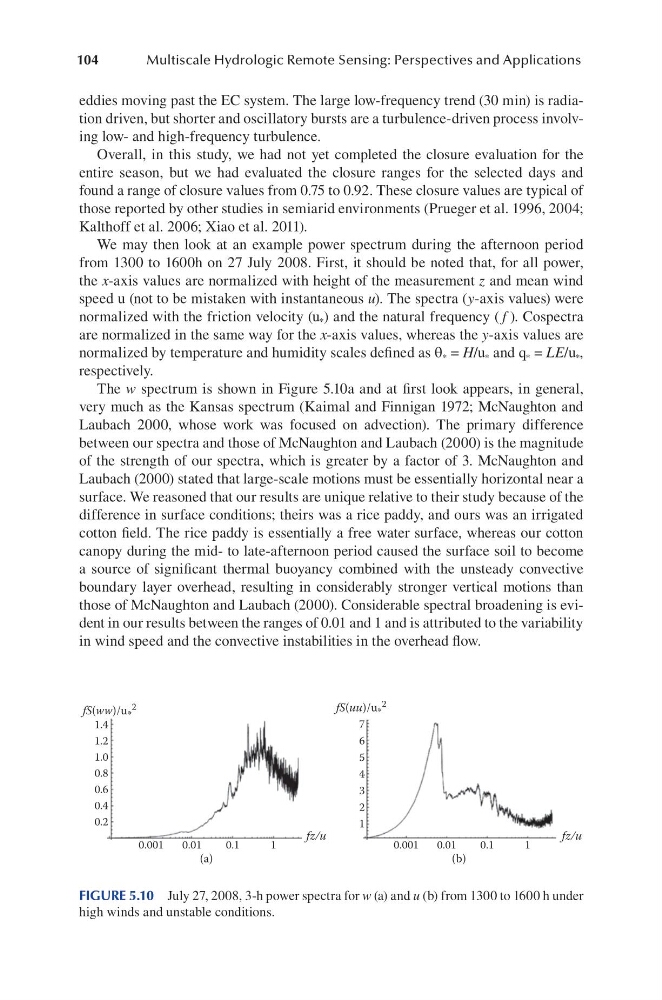
The w spectrum is shown in Figure 5.10a and at first look appears, in general,
very much as the Kansas spectrum (Kaimal and Finnigan 1972; McNaughton and
Laubach 2000, whose work was focused on advection). The primary difference
between our spectra and those of McNaughton and Laubach (2000) is the magnitude
of the strength of our spectra, which is greater by a factor of 3. McNaughton and
Laubach (2000) stated that large-scale motions must be essentially horizontal near a
surface. We reasoned that our results are unique relative to their study because of the
difference in surface conditions; theirs was a rice paddy, and ours was an irrigated
cotton field. The rice paddy is essentially a free water surface, whereas our cotton
canopy during the mid- to late-afternoon period caused the surface soil to become
a source of significant thermal buoyancy combined with the unsteady convective
boundary layer overhead, resulting in considerably stronger vertical motions than
those of McNaughton and Laubach (2000). Considerable spectral broadening is evident in our results between the ranges of 0.01 and 1 and is attributed to the variability
in wind speed and the convective instabilities in the overhead flow.
1.0
1.2
1.4
fS(ww)/u *
2
fS(uu)/u *
2
fz/u
fz/u
0.8
0.6
7
6
5
4
3
2
1
0.4
0.2
0.001
0.01
0.1
1
0.001
0.01
0.1
1
(a)
(b)
FIGURE 5.10 July 27, 2008, 3-h power spectra for w (a) and u (b) from 1300 to 1600 h under
high winds and unstable conditions.
Multiscale Hydrologic Remote Sensing: Perspectives and Applications
eddies moving past the EC system. The large low-frequency trend (30 min) is radiation driven, but shorter and oscillatory bursts are a turbulence-driven process involving low- and high-frequency turbulence.
Overall, in this study, we had not yet completed the closure evaluation for the
entire season, but we had evaluated the closure ranges for the selected days and
found a range of closure values from 0.75 to 0.92. These closure values are typical of
those reported by other studies in semiarid environments (Prueger et al. 1996, 2004;
Kalthoff et al. 2006; Xiao et al. 2011).
We may then look at an example power spectrum during the afternoon period
from 1300 to 1600h on 27 July 2008. First, it should be noted that, for all power,
the x-axis values are normalized with height of the measurement z and mean wind
speed u (not to be mistaken with instantaneous u). The spectra (y-axis values) were
normalized with the friction velocity (u * ) and the natural frequency ( f ). Cospectra
are normalized in the same way for the x-axis values, whereas the y-axis values are
normalized by temperature and humidity scales defined as θ * = H/u * and q * = LE/u * ,
respectively.
The w spectrum is shown in Figure 5.10a and at first look appears, in general,
very much as the Kansas spectrum (Kaimal and Finnigan 1972; McNaughton and
Laubach 2000, whose work was focused on advection). The primary difference
between our spectra and those of McNaughton and Laubach (2000) is the magnitude
of the strength of our spectra, which is greater by a factor of 3. McNaughton and
Laubach (2000) stated that large-scale motions must be essentially horizontal near a
surface. We reasoned that our results are unique relative to their study because of the
difference in surface conditions; theirs was a rice paddy, and ours was an irrigated
cotton field. The rice paddy is essentially a free water surface, whereas our cotton
canopy during the mid- to late-afternoon period caused the surface soil to become
a source of significant thermal buoyancy combined with the unsteady convective
boundary layer overhead, resulting in considerably stronger vertical motions than
those of McNaughton and Laubach (2000). Considerable spectral broadening is evident in our results between the ranges of 0.01 and 1 and is attributed to the variability
in wind speed and the convective instabilities in the overhead flow.
1.0
1.2
1.4
fS(ww)/u *
2
fS(uu)/u *
2
fz/u
fz/u
0.8
0.6
7
6
5
4
3
2
1
0.4
0.2
0.001
0.01
0.1
1
0.001
0.01
0.1
1
(a)
(b)
FIGURE 5.10 July 27, 2008, 3-h power spectra for w (a) and u (b) from 1300 to 1600 h under
high winds and unstable conditions.