

100
Multiscale Hydrologic Remote Sensing: Perspectives and Applications
approximately 5 s, with an average mean wind speed of ~6 m s –1 , and assuming
Taylor’s hypothesis, the mean eddy diameter for this event was approximately 30
m. Other distinct eddies are also evident at ranges of spatial and temporal scales
that demonstrate the variability and nature of eddies within eddies. The vertical
wind velocity plot (Figure 5.5b) is less defined than u but is to be expected, since the
surface acts as a firm boundary. Nevertheless, careful observation does reveal finer
features in the vertical motions as well as a range of spatial scales. Vertical gusts
both in the updrafts and downdrafts can be observed to peak between –3 and 3 m s –1 ,
which is indicative of low-frequency eddies (large) penetrating the surface boundary
that contain substantial energy that can influence interpretation of turbulent fluxes
of heat and water vapor.
(a)
(b)
1 31 61 91 121 151 181 211 241 271 301 331 361 391 421 451 481
Time: 0.05 s
1 31 61 91 121 151 181 211 241 271 301 331 361 391 421 451 481
Time: 0.05 s
29.8
29.9
30.0
30.1
30.2
30.3
30.4
30.5
Temp (°C)
12.1
12.2
12.3
12.4
12.5
12.6
12.7
12.8
12.9
ρ
v (kg m –3
)
Stable
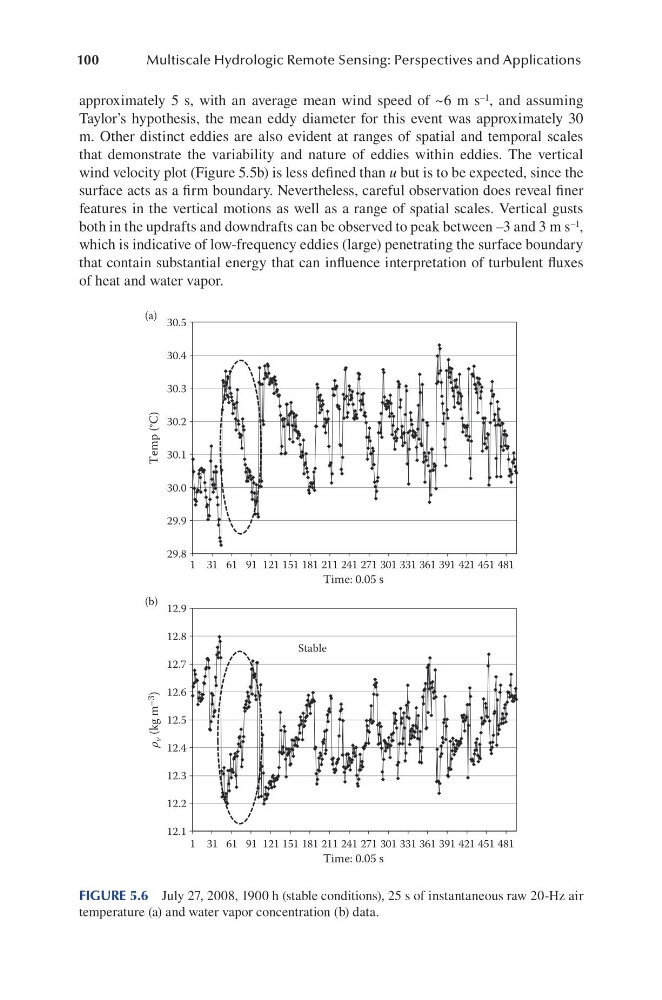
FIGURE 5.6 July 27, 2008, 1900 h (stable conditions), 25 s of instantaneous raw 20-Hz air
temperature (a) and water vapor concentration (b) data.
Multiscale Hydrologic Remote Sensing: Perspectives and Applications
approximately 5 s, with an average mean wind speed of ~6 m s –1 , and assuming
Taylor’s hypothesis, the mean eddy diameter for this event was approximately 30
m. Other distinct eddies are also evident at ranges of spatial and temporal scales
that demonstrate the variability and nature of eddies within eddies. The vertical
wind velocity plot (Figure 5.5b) is less defined than u but is to be expected, since the
surface acts as a firm boundary. Nevertheless, careful observation does reveal finer
features in the vertical motions as well as a range of spatial scales. Vertical gusts
both in the updrafts and downdrafts can be observed to peak between –3 and 3 m s –1 ,
which is indicative of low-frequency eddies (large) penetrating the surface boundary
that contain substantial energy that can influence interpretation of turbulent fluxes
of heat and water vapor.
(a)
(b)
1 31 61 91 121 151 181 211 241 271 301 331 361 391 421 451 481
Time: 0.05 s
1 31 61 91 121 151 181 211 241 271 301 331 361 391 421 451 481
Time: 0.05 s
29.8
29.9
30.0
30.1
30.2
30.3
30.4
30.5
Temp (°C)
12.1
12.2
12.3
12.4
12.5
12.6
12.7
12.8
12.9
ρ
v (kg m –3
)
Stable
FIGURE 5.6 July 27, 2008, 1900 h (stable conditions), 25 s of instantaneous raw 20-Hz air
temperature (a) and water vapor concentration (b) data.