

99
Thermal Radiation and Energy Closure Assessment
5.6 RESULTS
A first look at the data in its unprocessed state can often reveal unique features of
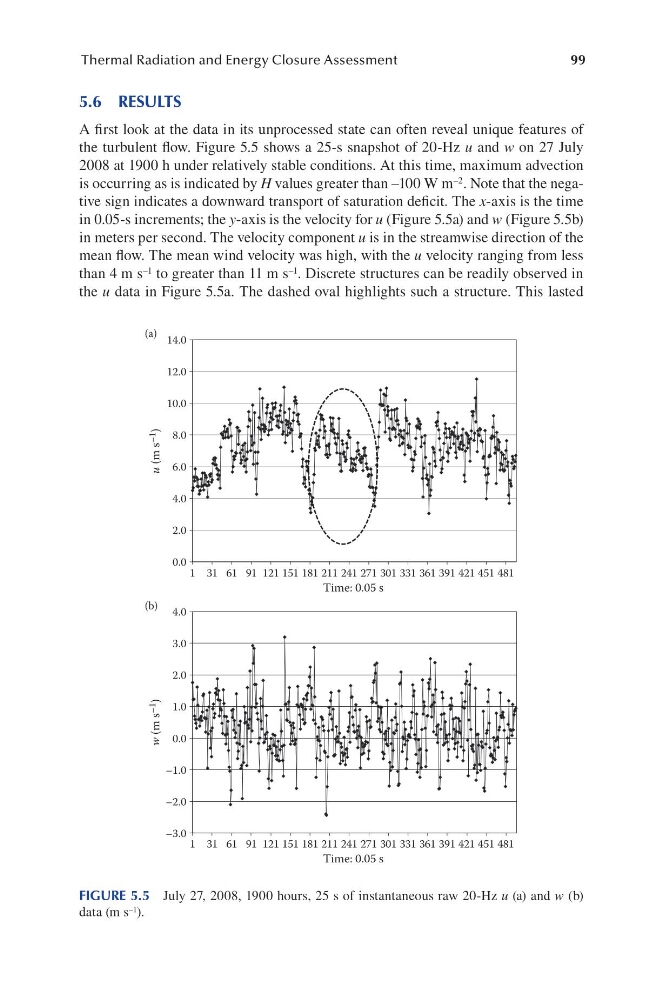
the turbulent flow. Figure 5.5 shows a 25-s snapshot of 20-Hz u and w on 27 July
2008 at 1900 h under relatively stable conditions. At this time, maximum advection
is occurring as is indicated by H values greater than –100 W m –2 . Note that the negative sign indicates a downward transport of saturation deficit. The x-axis is the time
in 0.05-s increments; the y-axis is the velocity for u (Figure 5.5a) and w (Figure 5.5b)
in meters per second. The velocity component u is in the streamwise direction of the
mean flow. The mean wind velocity was high, with the u velocity ranging from less
than 4 m s –1 to greater than 11 m s –1 . Discrete structures can be readily observed in
the u data in Figure 5.5a. The dashed oval highlights such a structure. This lasted
0.0
2.0
4.0
6.0
8.0
10.0
12.0
14.0
(a)
(b)
1 31 61 91 121 151 181 211 241 271 301 331 361 391 421 451 481
u (m s –1
)
w (m s –1
)
Time: 0.05 s
1 31 61 91 121 151 181 211 241 271 301 331 361 391 421 451 481
Time: 0.05 s
–3.0
–2.0
–1.0
0.0
1.0
2.0
3.0
4.0
FIGURE 5.5 July 27, 2008, 1900 hours, 25 s of instantaneous raw 20-Hz u (a) and w (b)
data (m s –1 ).
Thermal Radiation and Energy Closure Assessment
5.6 RESULTS
A first look at the data in its unprocessed state can often reveal unique features of
the turbulent flow. Figure 5.5 shows a 25-s snapshot of 20-Hz u and w on 27 July
2008 at 1900 h under relatively stable conditions. At this time, maximum advection
is occurring as is indicated by H values greater than –100 W m –2 . Note that the negative sign indicates a downward transport of saturation deficit. The x-axis is the time
in 0.05-s increments; the y-axis is the velocity for u (Figure 5.5a) and w (Figure 5.5b)
in meters per second. The velocity component u is in the streamwise direction of the
mean flow. The mean wind velocity was high, with the u velocity ranging from less
than 4 m s –1 to greater than 11 m s –1 . Discrete structures can be readily observed in
the u data in Figure 5.5a. The dashed oval highlights such a structure. This lasted
0.0
2.0
4.0
6.0
8.0
10.0
12.0
14.0
(a)
(b)
1 31 61 91 121 151 181 211 241 271 301 331 361 391 421 451 481
u (m s –1
)
w (m s –1
)
Time: 0.05 s
1 31 61 91 121 151 181 211 241 271 301 331 361 391 421 451 481
Time: 0.05 s
–3.0
–2.0
–1.0
0.0
1.0
2.0
3.0
4.0
FIGURE 5.5 July 27, 2008, 1900 hours, 25 s of instantaneous raw 20-Hz u (a) and w (b)
data (m s –1 ).