

81
Comparative Analysis of Surface Energy Balance Models
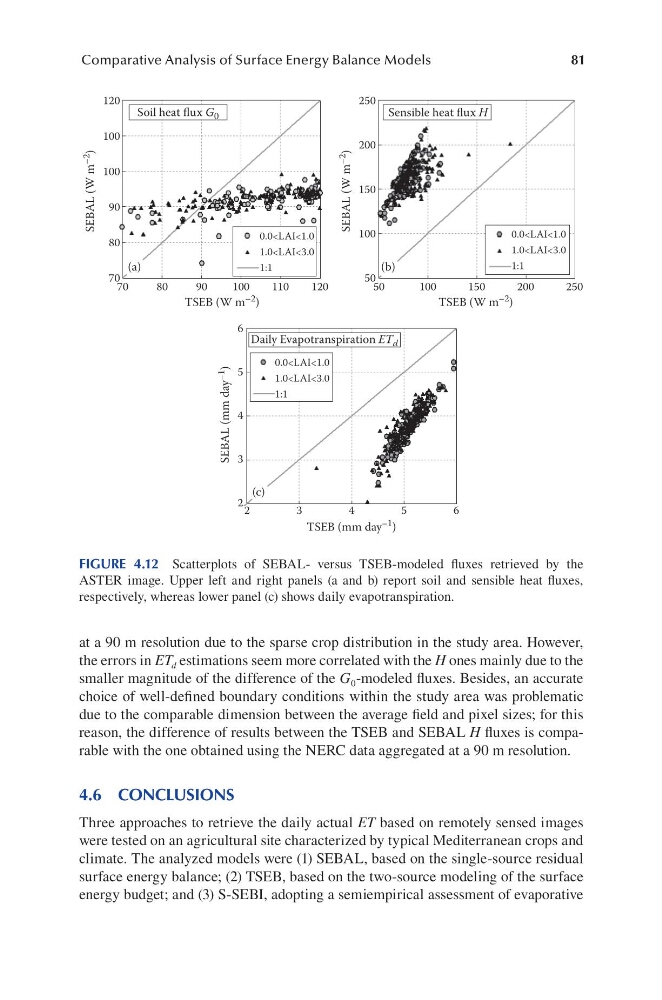
at a 90 m resolution due to the sparse crop distribution in the study area. However,
the errors in ET d estimations seem more correlated with the H ones mainly due to the
smaller magnitude of the difference of the G 0 -modeled fluxes. Besides, an accurate
choice of well-defined boundary conditions within the study area was problematic
due to the comparable dimension between the average field and pixel sizes; for this
reason, the difference of results between the TSEB and SEBAL H fluxes is comparable with the one obtained using the NERC data aggregated at a 90 m resolution.
4.6 CONCLUSIONS
Three approaches to retrieve the daily actual ET based on remotely sensed images
were tested on an agricultural site characterized by typical Mediterranean crops and
climate. The analyzed models were (1) SEBAL, based on the single-source residual
surface energy balance; (2) TSEB, based on the two-source modeling of the surface
energy budget; and (3) S-SEBI, adopting a semiempirical assessment of evaporative
120
100
100
SEBAL (W m –2
)
SEBAL (mm day –1
)
TSEB (W m –2 )
(a)
Soil heat flux G 0
Daily Evapotranspiration ET d
Sensible heat flux H
(b)
(c)
TSEB (W m –2 )
TSEB (mm day –1 )
SEBAL (W m –2
)
90
80
70
250
200
150
100
50
70
80
90
100
110
120
50
100
150
200
250
0.0
0.0
0.0
6
5
4
3
2
2
3
4
5
6
FIGURE 4.12 Scatterplots of SEBAL- versus TSEB-modeled fluxes retrieved by the
ASTER image. Upper left and right panels (a and b) report soil and sensible heat fluxes,
respectively, whereas lower panel (c) shows daily evapotranspiration.
Comparative Analysis of Surface Energy Balance Models
at a 90 m resolution due to the sparse crop distribution in the study area. However,
the errors in ET d estimations seem more correlated with the H ones mainly due to the
smaller magnitude of the difference of the G 0 -modeled fluxes. Besides, an accurate
choice of well-defined boundary conditions within the study area was problematic
due to the comparable dimension between the average field and pixel sizes; for this
reason, the difference of results between the TSEB and SEBAL H fluxes is comparable with the one obtained using the NERC data aggregated at a 90 m resolution.
4.6 CONCLUSIONS
Three approaches to retrieve the daily actual ET based on remotely sensed images
were tested on an agricultural site characterized by typical Mediterranean crops and
climate. The analyzed models were (1) SEBAL, based on the single-source residual
surface energy balance; (2) TSEB, based on the two-source modeling of the surface
energy budget; and (3) S-SEBI, adopting a semiempirical assessment of evaporative
120
100
100
SEBAL (W m –2
)
SEBAL (mm day –1
)
TSEB (W m –2 )
(a)
Soil heat flux G 0
Daily Evapotranspiration ET d
Sensible heat flux H
(b)
(c)
TSEB (W m –2 )
TSEB (mm day –1 )
SEBAL (W m –2
)
90
80
70
250
200
150
100
50
70
80
90
100
110
120
50
100
150
200
250
0.0
0.0
0.0
6
5
4
3
2
2
3
4
5
6
FIGURE 4.12 Scatterplots of SEBAL- versus TSEB-modeled fluxes retrieved by the
ASTER image. Upper left and right panels (a and b) report soil and sensible heat fluxes,
respectively, whereas lower panel (c) shows daily evapotranspiration.