

doubling of CO 2 include temperature increases
between 1.5 and 4.5
C and global precipitation
increases between +3 and +15 %.
Boundaries of ecoregions coincide with certain climatic parameters. Based on macroclimatic
conditions and on the prevailing plant formations
determined by those conditions, I subdivided the
continents into ecoregions with three levels of
detail. Of these, the broadest, domains, and
within them divisions, are based largely on the
broad ecological zones of the German geographer, Wladimir Ko ¨ppen (1931; as modified by
Trewartha 1968, Chap. 4). Zone boundaries take
into account the near-surface air temperature and
precipitation as the major variables with respect
to their annual cycles and their linkages with
natural vegetation patterns. Assignment is based
on quantitative definitions and, as such, can be
applied to any part of the Earth where climatic
data are available. It is thereby possible to
develop world maps for future climate simulated,
for instance, under elevated atmospheric CO 2
concentrations.
The
Ko ¨ppen–Trewartha
classification
identified six main groups of climate, and all
but one—the dry group—are thermally defined
(see Table 4.2). They are as follows:
Based on temperature criteria
A. Tropical: Frost limits in continental locations;
in marine areas 18
C for the coolest month
C. Subtropical: 8 months 10
C or above
D. Temperate: 4 months 10
C or above
E. Boreal: 1 (warmest) month 10
C or above
F. Polar: All months below 10
C
Based on precipitation criteria
B. Dry: Outer limits, where potential evaporation
equals precipitation
Future changes in the Ko ¨ppen climate types
have been reported by different authors (e.g., de
Castro et al. 2007; Rubel and Kottek 2010; Baker
et al. 2010; Chen and Chen 2013). Gregory
(1954) discusses boundary migrations in
response to climate change using the
Ko ¨ppen–Trewartha classification. The sensitivity
of the Ko ¨ppen climate classification to global
climatic change was tested by remapping the
Ko ¨ppen climate classes for an alternative climate
by Kalvova et al. (2003). These investigators
used the output of a series of general circulation
models (GCM) to simulate climate for the period
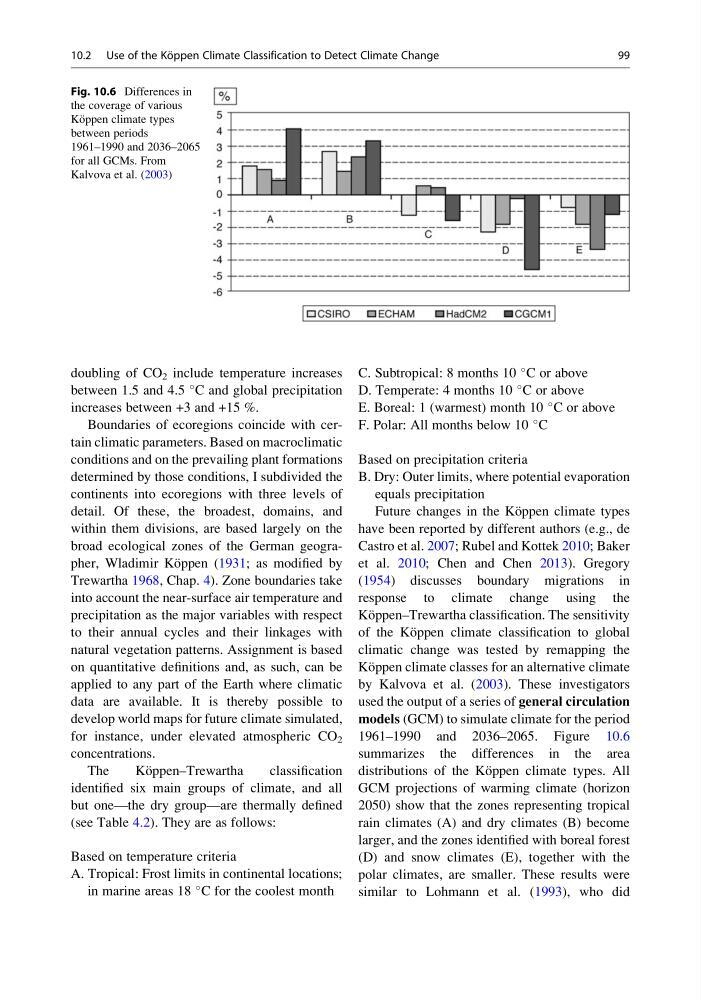
1961–1990 and 2036–2065. Figure 10.6
summarizes the differences in the area
distributions of the Ko ¨ppen climate types. All
GCM projections of warming climate (horizon
2050) show that the zones representing tropical
rain climates (A) and dry climates (B) become
larger, and the zones identified with boreal forest
(D) and snow climates (E), together with the
polar climates, are smaller. These results were
similar to Lohmann et al. (1993), who did
Fig. 10.6 Differences in
the coverage of various
Ko ¨ppen climate types
between periods
1961–1990 and 2036–2065
for all GCMs. From
Kalvova et al. (2003)
10.2 Use of the Ko ¨ ppen Climate Classification to Detect Climate Change
99
between 1.5 and 4.5
C and global precipitation
increases between +3 and +15 %.
Boundaries of ecoregions coincide with certain climatic parameters. Based on macroclimatic
conditions and on the prevailing plant formations
determined by those conditions, I subdivided the
continents into ecoregions with three levels of
detail. Of these, the broadest, domains, and
within them divisions, are based largely on the
broad ecological zones of the German geographer, Wladimir Ko ¨ppen (1931; as modified by
Trewartha 1968, Chap. 4). Zone boundaries take
into account the near-surface air temperature and
precipitation as the major variables with respect
to their annual cycles and their linkages with
natural vegetation patterns. Assignment is based
on quantitative definitions and, as such, can be
applied to any part of the Earth where climatic
data are available. It is thereby possible to
develop world maps for future climate simulated,
for instance, under elevated atmospheric CO 2
concentrations.
The
Ko ¨ppen–Trewartha
classification
identified six main groups of climate, and all
but one—the dry group—are thermally defined
(see Table 4.2). They are as follows:
Based on temperature criteria
A. Tropical: Frost limits in continental locations;
in marine areas 18
C for the coolest month
C. Subtropical: 8 months 10
C or above
D. Temperate: 4 months 10
C or above
E. Boreal: 1 (warmest) month 10
C or above
F. Polar: All months below 10
C
Based on precipitation criteria
B. Dry: Outer limits, where potential evaporation
equals precipitation
Future changes in the Ko ¨ppen climate types
have been reported by different authors (e.g., de
Castro et al. 2007; Rubel and Kottek 2010; Baker
et al. 2010; Chen and Chen 2013). Gregory
(1954) discusses boundary migrations in
response to climate change using the
Ko ¨ppen–Trewartha classification. The sensitivity
of the Ko ¨ppen climate classification to global
climatic change was tested by remapping the
Ko ¨ppen climate classes for an alternative climate
by Kalvova et al. (2003). These investigators
used the output of a series of general circulation
models (GCM) to simulate climate for the period
1961–1990 and 2036–2065. Figure 10.6
summarizes the differences in the area
distributions of the Ko ¨ppen climate types. All
GCM projections of warming climate (horizon
2050) show that the zones representing tropical
rain climates (A) and dry climates (B) become
larger, and the zones identified with boreal forest
(D) and snow climates (E), together with the
polar climates, are smaller. These results were
similar to Lohmann et al. (1993), who did
Fig. 10.6 Differences in
the coverage of various
Ko ¨ppen climate types
between periods
1961–1990 and 2036–2065
for all GCMs. From
Kalvova et al. (2003)
10.2 Use of the Ko ¨ ppen Climate Classification to Detect Climate Change
99