

Plate Stratigraphy and CCD Auctuations
269
noncarbonate (Fig. 9.16). In the example, the site crossed at a paleodepth of 3.6 km,
90 million years ago.
To obtain a number of crossings, which would allow reconstruction of fluctuations, we apply the same procedure to a number of sites in the same region. In an
age-depth diagram, each drill site will appear as a subsidence curve, on which the
sedimentary facies (and rates of sedimentation) can be plotted. The changes in CCD
will appear as changing depths of the carbonate-to-noncarbonate boundary. Conditions do not always allow positioning of the CCD by backtracking. Upon moving
down the ridge flank, calcareous sediment can be deeply eroded, wherever bottom
currents remove the protective clay cover, so that "deep-sea karst" can form (Fig.
9.17). When this happens, backtracking will not find the depth of the CCD crossing;
the path of the site will show a hiatus extending above and below that depth level.
9.7.2 Atlantic and Pacific CCD Fluctuations. Reconstructions of CCD fluctuations
provide useful information on deep circulation, on overall and regional productivity,
and on the sharing of carbonate between shelf and deep-sea floor. Quite generally, the
CCD is one of the important proxies for the chemical state of the ocean that bears on
atmospheric C02 content.
Reconstructions differ somewhat depending on the available datings of basement
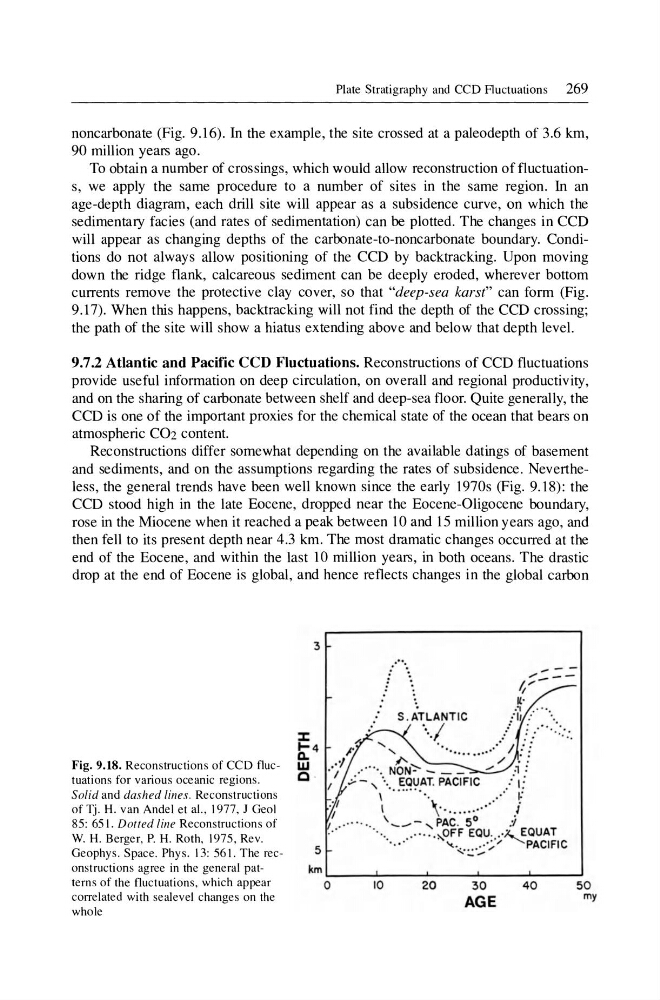
and sediments, and on the assumptions regarding the rates of subsidence. Nevertheless, the general trends have been well known since the early 1970s (Fig. 9.18): the
CCD stood high in the late Eocene, dropped near the Eocene-Oligocene boundary,
rose in the Miocene when it reached a peak between 10 and 15 million years ago, and
then fell to its present depth near 4.3 km . The most dramatic changes occurred at the
end of the Eocene, and within the last 10 million years, in both oceans. The drastic
drop at the end of Eocene is global, and hence reflects changes in the global carbon
Fig. 9.18. Reconstructions of CCD fluctuations for various oceanic regions.
Solid and dashed lines. Reconstructions
of Tj . H. van Andel et al.. 1977, J Geol
85: 651. Dotted line Reconstructions of
W. H. Berger, P. H. Roth, 1975 , Rev.
Geophys. Space. Phys . 13: 561. The reconstructions agree in the general patterns of the fluctuations, which appear
correlated with sealevel changes on the
whole
::E:
~4
W
Q .
5
.... -...-
1/'It·
., .' " .
: 11 :
.
........ / . . . ... ::.:.
1 : '
.. ........ /: ;
I'
/ ..
•.•• . •• • NON"> - _ _
/
.=1 .:
.;- - , '" EQUAT. PACIFIC
: I'
\ '. ........
. ..... f
I
\ . . . . ......
J
. . . .. '_ ..... -,PAC . 5°
.1
' . ".
• .. . . . . ~OFF EQU .... ~QUAT
..• .
'<.". :.;.;;';'/
PACIFIC
km~ ____ ~ ____ ~ ____ ~ ____ ~ ____ ~
o
10
20
30
AGE
40
50
my
269
noncarbonate (Fig. 9.16). In the example, the site crossed at a paleodepth of 3.6 km,
90 million years ago.
To obtain a number of crossings, which would allow reconstruction of fluctuations, we apply the same procedure to a number of sites in the same region. In an
age-depth diagram, each drill site will appear as a subsidence curve, on which the
sedimentary facies (and rates of sedimentation) can be plotted. The changes in CCD
will appear as changing depths of the carbonate-to-noncarbonate boundary. Conditions do not always allow positioning of the CCD by backtracking. Upon moving
down the ridge flank, calcareous sediment can be deeply eroded, wherever bottom
currents remove the protective clay cover, so that "deep-sea karst" can form (Fig.
9.17). When this happens, backtracking will not find the depth of the CCD crossing;
the path of the site will show a hiatus extending above and below that depth level.
9.7.2 Atlantic and Pacific CCD Fluctuations. Reconstructions of CCD fluctuations
provide useful information on deep circulation, on overall and regional productivity,
and on the sharing of carbonate between shelf and deep-sea floor. Quite generally, the
CCD is one of the important proxies for the chemical state of the ocean that bears on
atmospheric C02 content.
Reconstructions differ somewhat depending on the available datings of basement
and sediments, and on the assumptions regarding the rates of subsidence. Nevertheless, the general trends have been well known since the early 1970s (Fig. 9.18): the
CCD stood high in the late Eocene, dropped near the Eocene-Oligocene boundary,
rose in the Miocene when it reached a peak between 10 and 15 million years ago, and
then fell to its present depth near 4.3 km . The most dramatic changes occurred at the
end of the Eocene, and within the last 10 million years, in both oceans. The drastic
drop at the end of Eocene is global, and hence reflects changes in the global carbon
Fig. 9.18. Reconstructions of CCD fluctuations for various oceanic regions.
Solid and dashed lines. Reconstructions
of Tj . H. van Andel et al.. 1977, J Geol
85: 651. Dotted line Reconstructions of
W. H. Berger, P. H. Roth, 1975 , Rev.
Geophys. Space. Phys . 13: 561. The reconstructions agree in the general patterns of the fluctuations, which appear
correlated with sealevel changes on the
whole
::E:
~4
W
Q .
5
.... -...-
1/'It·
., .' " .
: 11 :
.
........ / . . . ... ::.:.
1 : '
.. ........ /: ;
I'
/ ..
•.•• . •• • NON"> - _ _
/
.=1 .:
.;- - , '" EQUAT. PACIFIC
: I'
\ '. ........
. ..... f
I
\ . . . . ......
J
. . . .. '_ ..... -,PAC . 5°
.1
' . ".
• .. . . . . ~OFF EQU .... ~QUAT
..• .
'<.". :.;.;;';'/
PACIFIC
km~ ____ ~ ____ ~ ____ ~ ____ ~ ____ ~
o
10
20
30
AGE
40
50
my