

148 Sea Level Processes and Effects of Sea Level Change
MARINE
OFFLAP
~ SUBAERIAl
I.:...:..:J EXPOSURE
UNCONFORMITIES
~ SUBMARINE
- - SUBAERIAL
~~388:~ COASTAL
~~~~~~ ON LAP
200 KM
E:3HIGHSTAND DEPOSITS
~ LOWSTAND DEPOSITS
~ OLDER ROCKS
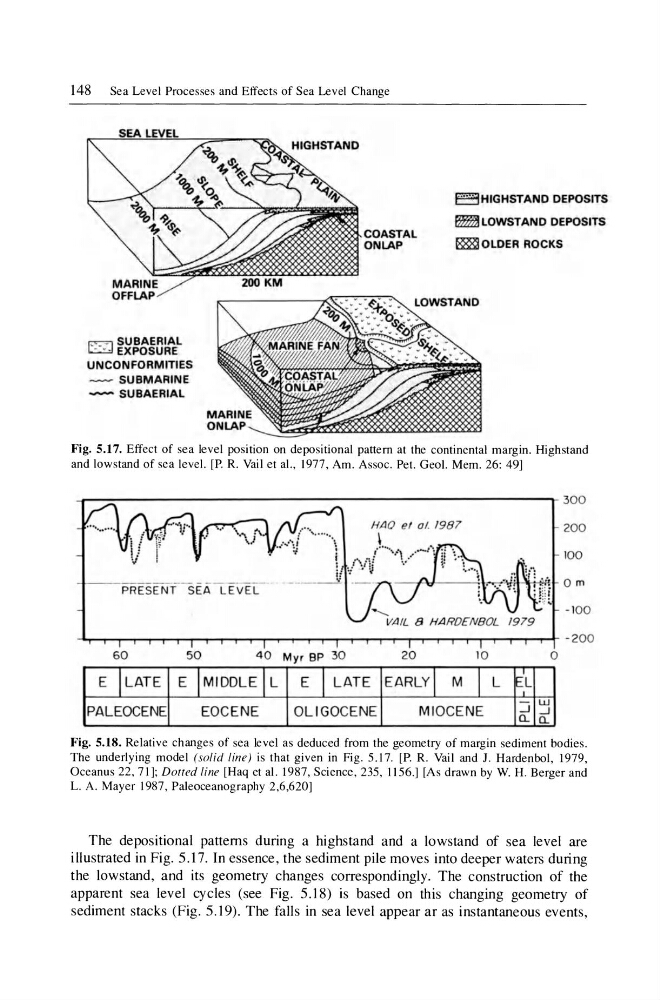
Fig. 5.17. Effect of sea level position on depositional pattern at the continental margin. Highstand
and lowstand of sea level. [P.R. Vail et aI., 1977, Am. Assoc. Pet. Oeol. Mem. 26: 49]
----------------------------------------------------~ 300
HAO ef 01. '9 8 1
200
100
PRESENT SEA LEVE L
- 100
60
50
4 0 Myr BP 30
20
10
o
E l LATE E IMIDDLE I L E I LATE EARLY I M I L ~'L
w
PALEOCENE
EOCE NE
OLI GOCE NE
MIOCENE
-1 -1
a... a...
Fig. 5.18. Relative changes of sea level as deduced from the geometry of margin sediment bodies.
The underlying model (solid line ) is that given in Fig. 5.17. [P. R. Vail and J. Hardenbol, 1979,
Oceanus 22 , 71]; Dotted line [Haq et al. 1987, Science , 235 , 1156.] [As drawn by W. H. Berger and
L. A. Mayer 1987, Paleoceanography 2,6,620]
The depositional patterns during a highstand and a lowstand of sea level are
illustrated in Fig. 5.17. In essence, the sediment pile moves into deeper waters during
the lowstand, and its geometry changes correspondingly. The construction of the
apparent sea level cycles (see Fig. 5.18) is based on this changing geometry of
sediment stacks (Fig. 5.19). The falls in sea level appear ar as instantaneous events,
MARINE
OFFLAP
~ SUBAERIAl
I.:...:..:J EXPOSURE
UNCONFORMITIES
~ SUBMARINE
- - SUBAERIAL
~~388:~ COASTAL
~~~~~~ ON LAP
200 KM
E:3HIGHSTAND DEPOSITS
~ LOWSTAND DEPOSITS
~ OLDER ROCKS
Fig. 5.17. Effect of sea level position on depositional pattern at the continental margin. Highstand
and lowstand of sea level. [P.R. Vail et aI., 1977, Am. Assoc. Pet. Oeol. Mem. 26: 49]
----------------------------------------------------~ 300
HAO ef 01. '9 8 1
200
100
PRESENT SEA LEVE L
- 100
60
50
4 0 Myr BP 30
20
10
o
E l LATE E IMIDDLE I L E I LATE EARLY I M I L ~'L
w
PALEOCENE
EOCE NE
OLI GOCE NE
MIOCENE
-1 -1
a... a...
Fig. 5.18. Relative changes of sea level as deduced from the geometry of margin sediment bodies.
The underlying model (solid line ) is that given in Fig. 5.17. [P. R. Vail and J. Hardenbol, 1979,
Oceanus 22 , 71]; Dotted line [Haq et al. 1987, Science , 235 , 1156.] [As drawn by W. H. Berger and
L. A. Mayer 1987, Paleoceanography 2,6,620]
The depositional patterns during a highstand and a lowstand of sea level are
illustrated in Fig. 5.17. In essence, the sediment pile moves into deeper waters during
the lowstand, and its geometry changes correspondingly. The construction of the
apparent sea level cycles (see Fig. 5.18) is based on this changing geometry of
sediment stacks (Fig. 5.19). The falls in sea level appear ar as instantaneous events,