

,1. Isotope Geochemistry in the Environment
65
375~
E
.... 370
"C~ 365
"~. 360
_.-•.River
Glatt I ~ < ~ t
direction of
groundwater flow
,
Sm
Distance
-lOOm
N
~'G6s
I-G,., i
I
i
S
"G8
"G7
Aquifer
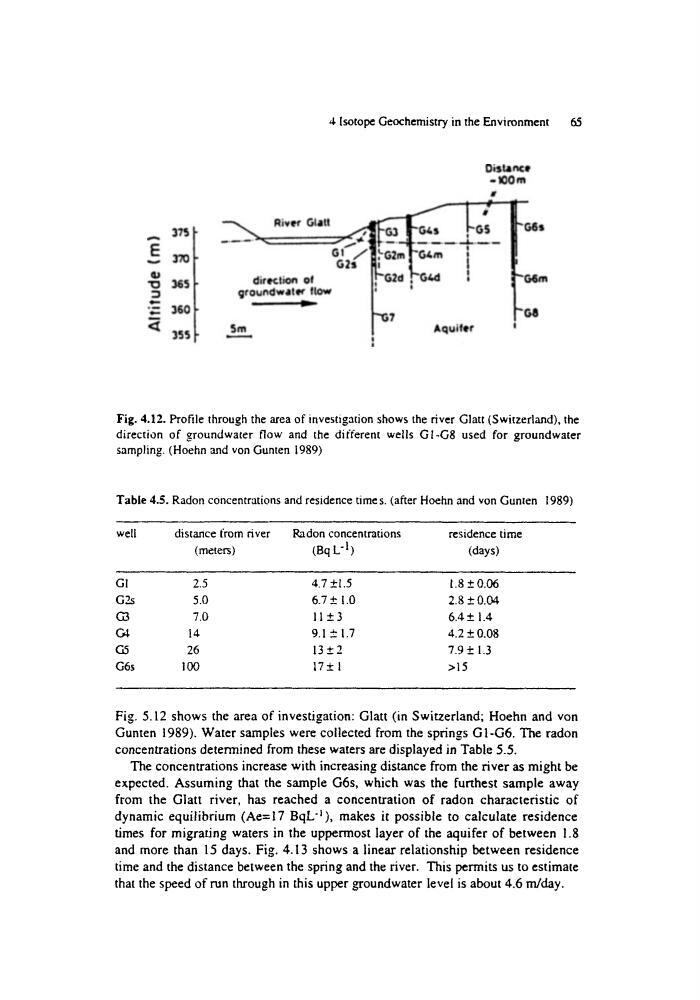
Fig. 4.12. Profile through the area of investigation shows the river Glatt (Switzerland), the
direction of groundwater flow and the different wells GI-G8 used for groundwater
sampling. (Hoehn and yon Gunten 1989)
Table 4.5. Radon concentrations and residence time s. (after Hoehn and yon Gumen 1989)
well
distance from river
Radon concentrations
residence time
(meters)
(Bq L" 1 )
(days)
G1
2.5
4.7•
1,8•
G~
5.0
6.7•
2 . 8 •
7.0
11•
6.4•
14
9.1•
4.2•
26
13•
7.9•
G~
1 ~
17•
>15
Fig. 5.12 shows the area of investigation: Glatt (in Switzerland; Hoehn and yon
Gunten 1989). Water samples were collected from the springs G1-G6. The radon
concentrations determined from these waters are displayed in Table 5.5.
The concentrations increase with increasing distance from the river as might be
expected. Assuming that the sample G6s, which was the furthest sample away
from the Glatt river, has reached a concentration of radon characteristic of
dynamic equilibrium (Ae=17 BqL -1), makes it possible to calculate residence
times for migrating waters in the uppermost layer of the aquifer of between 1.8
and more than 15 days. Fig. 4.13 shows a linear relationship between residence
time and the distance between the spring and the river. This permits us to estimate
that the speed of run through in this upper ~oundwater level is about 4.6 m/day.
65
375~
E
.... 370
"C~ 365
"~. 360
_.-•.River
Glatt I ~ < ~ t
direction of
groundwater flow
,
Sm
Distance
-lOOm
N
~'G6s
I-G,., i
I
i
S
"G8
"G7
Aquifer
Fig. 4.12. Profile through the area of investigation shows the river Glatt (Switzerland), the
direction of groundwater flow and the different wells GI-G8 used for groundwater
sampling. (Hoehn and yon Gunten 1989)
Table 4.5. Radon concentrations and residence time s. (after Hoehn and yon Gumen 1989)
well
distance from river
Radon concentrations
residence time
(meters)
(Bq L" 1 )
(days)
G1
2.5
4.7•
1,8•
G~
5.0
6.7•
2 . 8 •
7.0
11•
6.4•
14
9.1•
4.2•
26
13•
7.9•
G~
1 ~
17•
>15
Fig. 5.12 shows the area of investigation: Glatt (in Switzerland; Hoehn and yon
Gunten 1989). Water samples were collected from the springs G1-G6. The radon
concentrations determined from these waters are displayed in Table 5.5.
The concentrations increase with increasing distance from the river as might be
expected. Assuming that the sample G6s, which was the furthest sample away
from the Glatt river, has reached a concentration of radon characteristic of
dynamic equilibrium (Ae=17 BqL -1), makes it possible to calculate residence
times for migrating waters in the uppermost layer of the aquifer of between 1.8
and more than 15 days. Fig. 4.13 shows a linear relationship between residence
time and the distance between the spring and the river. This permits us to estimate
that the speed of run through in this upper ~oundwater level is about 4.6 m/day.