

158 Peter Stille and Graham Shields
E ",,r"
tt~
O
z,~
g
|
|
0
10
20
30
K-Feldspar (%1
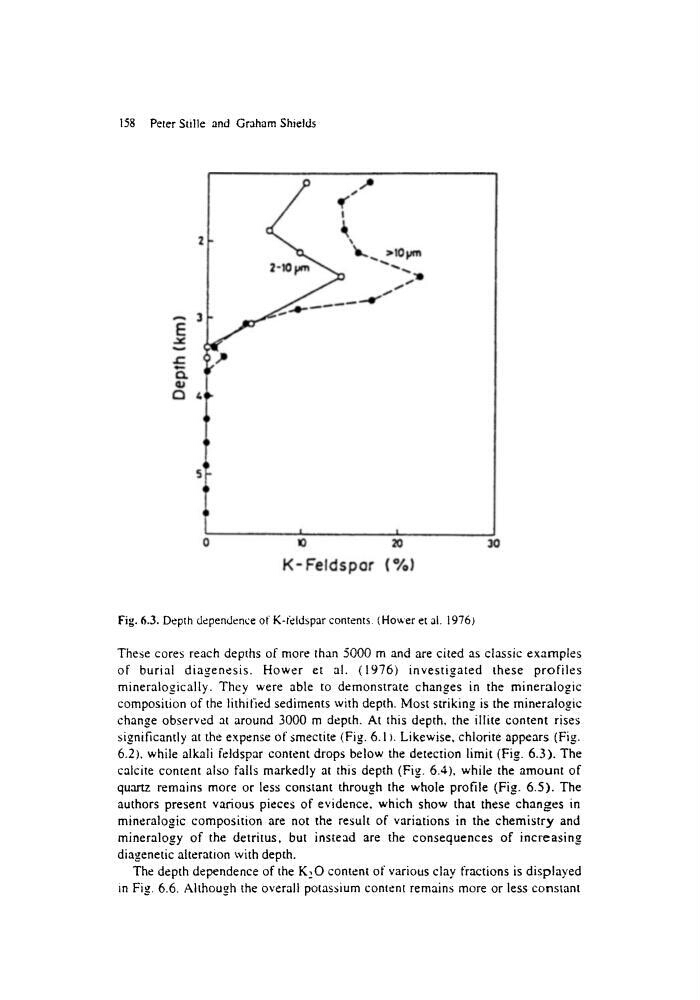
Fig. 6.3. Depth dependence of K-feldspar contents (Hov,er et al. 1976)
These cores reach depths of more than 5000 m and are cited as classic examples
of burial diagenesis. Hower et al. (1976) investigated these profiles
mineralogically. They were able to demonstrate changes in the mineralogic
composition of the lithified sediments with depth. Most striking is the mineralogic
change observed at around 3000 m depth. At this depth, the illite content rises
significantly at the expense of smectite (Fig. 6. I). Likewise, chlorite appears (Fig.
6.2), while alkali feldspar content drops below the detection limit (Fig. 6.3). The
calcite content also falls markedly at this depth (Fig. 6.4), while the amount of
quartz remains more or less constant through the whole profile (Fig. 6.5). The
authors present various pieces of evidence, which show that these changes in
mineralogic composition are not the result of variations in the chemistry and
mineralogy of the detritus, but instead are the consequences of increasing
diagenetic alteration with depth.
The depth dependence of the K.,O content of various clay fractions is displayed
in Fig. 6.6. Although the overall potassium content remains more or less constant
E ",,r"
tt~
O
z,~
g
|
|
0
10
20
30
K-Feldspar (%1
Fig. 6.3. Depth dependence of K-feldspar contents (Hov,er et al. 1976)
These cores reach depths of more than 5000 m and are cited as classic examples
of burial diagenesis. Hower et al. (1976) investigated these profiles
mineralogically. They were able to demonstrate changes in the mineralogic
composition of the lithified sediments with depth. Most striking is the mineralogic
change observed at around 3000 m depth. At this depth, the illite content rises
significantly at the expense of smectite (Fig. 6. I). Likewise, chlorite appears (Fig.
6.2), while alkali feldspar content drops below the detection limit (Fig. 6.3). The
calcite content also falls markedly at this depth (Fig. 6.4), while the amount of
quartz remains more or less constant through the whole profile (Fig. 6.5). The
authors present various pieces of evidence, which show that these changes in
mineralogic composition are not the result of variations in the chemistry and
mineralogy of the detritus, but instead are the consequences of increasing
diagenetic alteration with depth.
The depth dependence of the K.,O content of various clay fractions is displayed
in Fig. 6.6. Although the overall potassium content remains more or less constant