

14-4. Peter Stille and Graham Shields
t0
9
8
u~
O 6
"~ 5
U3
o
L
)O
I
rn GPC 3, Pegram et at. (1992)
9 Leg 92, Ravizza (1993)
A 8utk sed. ('high sed. rate)
9 Leach (high sed. rate)
O Leach (tow sect rate, site 596
r
t ~
9 I
9
0~0
I
I
I
= !
o
o
[3'
o
I
I
Ol
I
!
I
J
I
|
....t I ,-:
515
I
r
!
,
Ll
,
30
Age (Mo)
1 I
I
I
I
,
I
I
0
I0
20
40
50
60
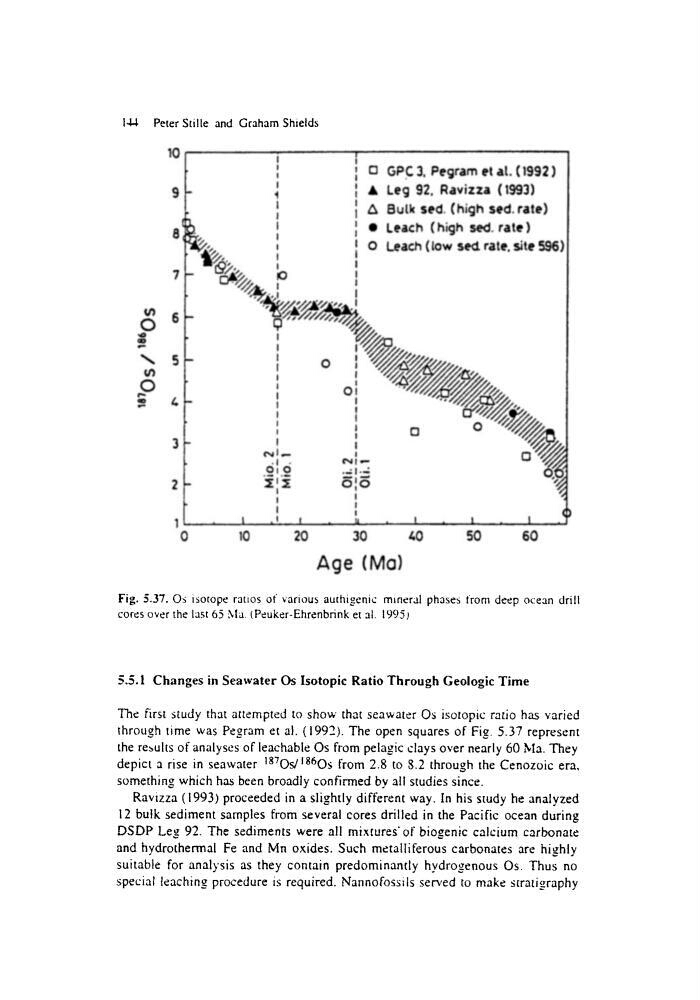
Fig. 5.37. Os isotope ratios ot various authigenic mineral phases from deep ocean drill
cores over the last 65 Ma. (Peuker-Ehrenbrink et al. 1995)
5.5.1 Changes in Seawater Os Isotopic Ratio Through Geologic Time
The first study that attempted to show that seawater Os isotopic ratio has varied
Ihrough time was Pegram et al. (1992). The open squares of Fig. 5.37 represent
the results of analyses of leachable Os from pelagic clays over nearly 60 Ma. They
depict a rise in seawater ISTOs/Jg6Os from 2.8 to 8.2 through the Cenozoic era,
something which has been broadly confirmed by all studies since.
Ravizza (1993) proceeded in a slightly different way. In his study he analyzed
12 bulk sediment samples from several cores drilled in the Pacific ocean during
DSDP Leg 92. The sediments were all mixtures'of biogenic calcium carbonate
and hydrothermal Fe and Mn oxides. Such metalliferous carbonates are highly
suitable for analysis as they contain predominantly hydrogenous Os. Thus no
special leaching procedure is required, Nannofossits served to make stratigraphy
t0
9
8
u~
O 6
"~ 5
U3
o
L
)O
I
rn GPC 3, Pegram et at. (1992)
9 Leg 92, Ravizza (1993)
A 8utk sed. ('high sed. rate)
9 Leach (high sed. rate)
O Leach (tow sect rate, site 596
r
t ~
9 I
9
0~0
I
I
I
= !
o
o
[3'
o
I
I
Ol
I
!
I
J
I
|
....t I ,-:
515
I
r
!
,
Ll
,
30
Age (Mo)
1 I
I
I
I
,
I
I
0
I0
20
40
50
60
Fig. 5.37. Os isotope ratios ot various authigenic mineral phases from deep ocean drill
cores over the last 65 Ma. (Peuker-Ehrenbrink et al. 1995)
5.5.1 Changes in Seawater Os Isotopic Ratio Through Geologic Time
The first study that attempted to show that seawater Os isotopic ratio has varied
Ihrough time was Pegram et al. (1992). The open squares of Fig. 5.37 represent
the results of analyses of leachable Os from pelagic clays over nearly 60 Ma. They
depict a rise in seawater ISTOs/Jg6Os from 2.8 to 8.2 through the Cenozoic era,
something which has been broadly confirmed by all studies since.
Ravizza (1993) proceeded in a slightly different way. In his study he analyzed
12 bulk sediment samples from several cores drilled in the Pacific ocean during
DSDP Leg 92. The sediments were all mixtures'of biogenic calcium carbonate
and hydrothermal Fe and Mn oxides. Such metalliferous carbonates are highly
suitable for analysis as they contain predominantly hydrogenous Os. Thus no
special leaching procedure is required, Nannofossits served to make stratigraphy