

47
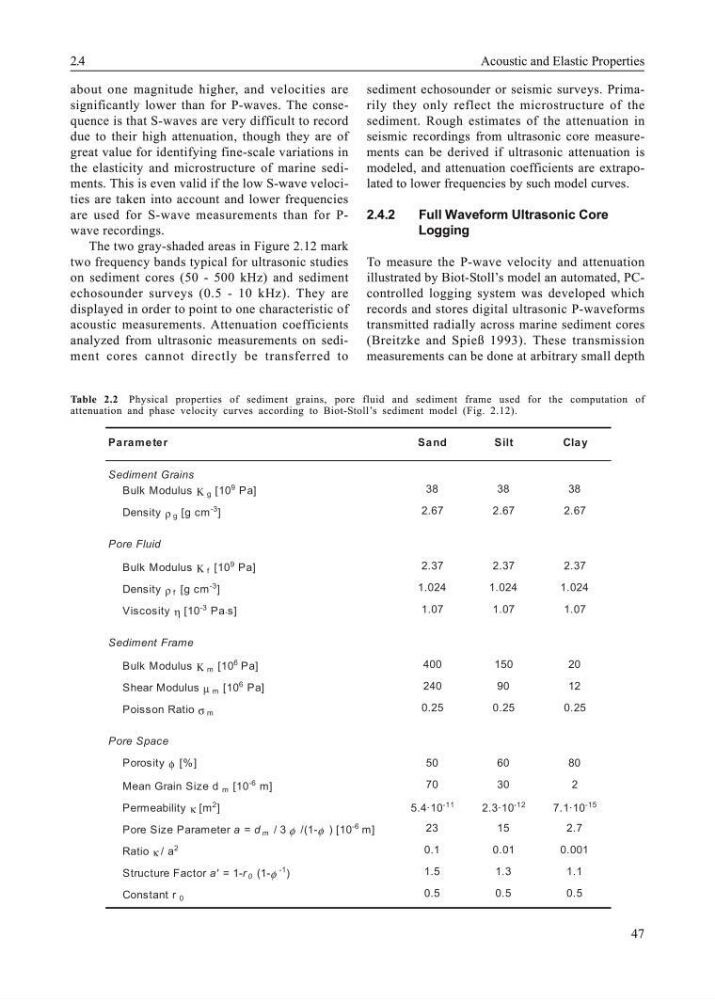
Table 2.2 Physical properties of sediment grains, pore fluid and sediment frame used for the computation of
attenuation and phase velocity curves according to Biot-Stoll’s sediment model (Fig. 2.12).
about one magnitude higher, and velocities are
significantly lower than for P-waves. The consequence is that S-waves are very difficult to record
due to their high attenuation, though they are of
great value for identifying fine-scale variations in
the elasticity and microstructure of marine sediments. This is even valid if the low S-wave velocities are taken into account and lower frequencies
are used for S-wave measurements than for Pwave recordings.
The two gray-shaded areas in Figure 2.12 mark
two frequency bands typical for ultrasonic studies
on sediment cores (50 - 500 kHz) and sediment
echosounder surveys (0.5 - 10 kHz). They are
displayed in order to point to one characteristic of
acoustic measurements. Attenuation coefficients
analyzed from ultrasonic measurements on sediment cores cannot directly be transferred to
sediment echosounder or seismic surveys. Primarily they only reflect the microstructure of the
sediment. Rough estimates of the attenuation in
seismic recordings from ultrasonic core measurements can be derived if ultrasonic attenuation is
modeled, and attenuation coefficients are extrapolated to lower frequencies by such model curves.
2.4.2
Full Waveform Ultrasonic Core
Logging
To measure the P-wave velocity and attenuation
illustrated by Biot-Stoll’s model an automated, PCcontrolled logging system was developed which
records and stores digital ultrasonic P-waveforms
transmitted radially across marine sediment cores
(Breitzke and Spieß 1993). These transmission
measurements can be done at arbitrary small depth
2.4
Acoustic and Elastic Properties
Pa rame ter
Sa nd
Silt
Cla y
Sediment Grains
Bulk Modulus Κ g [10
9 Pa]
38
38
38
Density ρ g [g cm
-3 ]
2.67
2.67
2.67
Pore Fluid
Bulk Modulus Κ f [10
9 Pa]
2.37
2.37
2.37
Density ρ f [g cm
-3 ]
1.024
1.024
1.024
Viscosity η [10
-3 Pa⋅s]
1.07
1.07
1.07
Sediment Frame
Bulk Modulus Κ m [10
6 Pa]
400
150
20
Shear Modulus µ m [10
6 Pa]
240
90
12
Poisson Ratio σ m
0.25
0.25
0.25
Pore Space
Porosity φ [%]
50
60
80
Mean Grain Size d m [10
-6 m]
70
30
2
Permeability κ [m
2 ]
5 . 4 · 1 0
-11
2.3·10
-12
7.1·10
-15
Pore Size Parameter a = d m / 3 φ /(1-φ ) [10
-6 m]
23
15
2.7
Ratio κ / a
2
0.1
0.01
0.001
Structure Factor a' = 1-r 0 (1-φ
-1 )
1.5
1.3
1.1
Constant r 0
0.5
0.5
0.5
Table 2.2 Physical properties of sediment grains, pore fluid and sediment frame used for the computation of
attenuation and phase velocity curves according to Biot-Stoll’s sediment model (Fig. 2.12).
about one magnitude higher, and velocities are
significantly lower than for P-waves. The consequence is that S-waves are very difficult to record
due to their high attenuation, though they are of
great value for identifying fine-scale variations in
the elasticity and microstructure of marine sediments. This is even valid if the low S-wave velocities are taken into account and lower frequencies
are used for S-wave measurements than for Pwave recordings.
The two gray-shaded areas in Figure 2.12 mark
two frequency bands typical for ultrasonic studies
on sediment cores (50 - 500 kHz) and sediment
echosounder surveys (0.5 - 10 kHz). They are
displayed in order to point to one characteristic of
acoustic measurements. Attenuation coefficients
analyzed from ultrasonic measurements on sediment cores cannot directly be transferred to
sediment echosounder or seismic surveys. Primarily they only reflect the microstructure of the
sediment. Rough estimates of the attenuation in
seismic recordings from ultrasonic core measurements can be derived if ultrasonic attenuation is
modeled, and attenuation coefficients are extrapolated to lower frequencies by such model curves.
2.4.2
Full Waveform Ultrasonic Core
Logging
To measure the P-wave velocity and attenuation
illustrated by Biot-Stoll’s model an automated, PCcontrolled logging system was developed which
records and stores digital ultrasonic P-waveforms
transmitted radially across marine sediment cores
(Breitzke and Spieß 1993). These transmission
measurements can be done at arbitrary small depth
2.4
Acoustic and Elastic Properties
Pa rame ter
Sa nd
Silt
Cla y
Sediment Grains
Bulk Modulus Κ g [10
9 Pa]
38
38
38
Density ρ g [g cm
-3 ]
2.67
2.67
2.67
Pore Fluid
Bulk Modulus Κ f [10
9 Pa]
2.37
2.37
2.37
Density ρ f [g cm
-3 ]
1.024
1.024
1.024
Viscosity η [10
-3 Pa⋅s]
1.07
1.07
1.07
Sediment Frame
Bulk Modulus Κ m [10
6 Pa]
400
150
20
Shear Modulus µ m [10
6 Pa]
240
90
12
Poisson Ratio σ m
0.25
0.25
0.25
Pore Space
Porosity φ [%]
50
60
80
Mean Grain Size d m [10
-6 m]
70
30
2
Permeability κ [m
2 ]
5 . 4 · 1 0
-11
2.3·10
-12
7.1·10
-15
Pore Size Parameter a = d m / 3 φ /(1-φ ) [10
-6 m]
23
15
2.7
Ratio κ / a
2
0.1
0.01
0.001
Structure Factor a' = 1-r 0 (1-φ
-1 )
1.5
1.3
1.1
Constant r 0
0.5
0.5
0.5