

2
Physical Properties of Marine Sediments
46
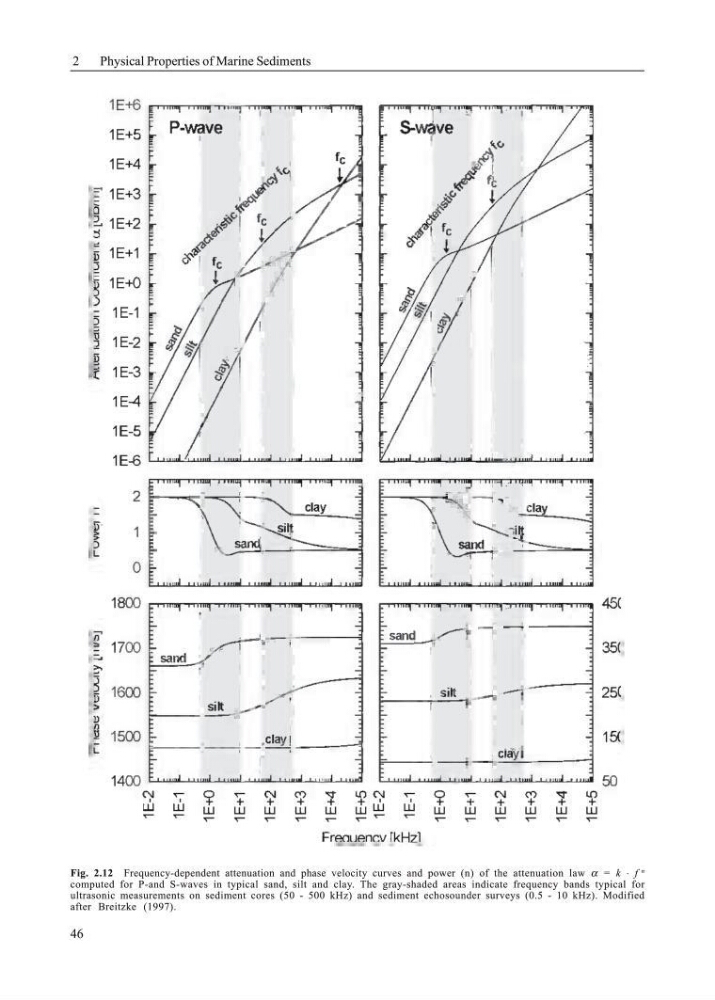
Fig. 2.12 Frequency-dependent attenuation and phase velocity curves and power (n) of the attenuation law α = k ⋅ f
n
computed for P-and S-waves in typical sand, silt and clay. The gray-shaded areas indicate frequency bands typical for
ultrasonic measurements on sediment cores (50 - 500 kHz) and sediment echosounder surveys (0.5 - 10 kHz). Modified
after Breitzke (1997).
Physical Properties of Marine Sediments
46
Fig. 2.12 Frequency-dependent attenuation and phase velocity curves and power (n) of the attenuation law α = k ⋅ f
n
computed for P-and S-waves in typical sand, silt and clay. The gray-shaded areas indicate frequency bands typical for
ultrasonic measurements on sediment cores (50 - 500 kHz) and sediment echosounder surveys (0.5 - 10 kHz). Modified
after Breitzke (1997).