

489
hydrocarbons by catagenesis (Fig. 14.7B). Catagenesis
occurs within the temperature range of 50° to 200° C,
and gases (methane to butane) are produced at rates
that are proportional to temperature.
At typical oceanic geothermal gradients of 20° to
50° C km
-1
, sediment depths larger than 1km are
required to produce significant amounts of gas by
thermochemical action. Because thermogenic gas
generation occurs at temperatures significantly
deeper than those found within the GHSZ, high
concentration of thermogenic gases within the GHSZ
generally indicates the existence of a hydrocarbon
migration pathway.
Biogenic and thermogenic gases can usually
be distinguished on the basis of chemical and
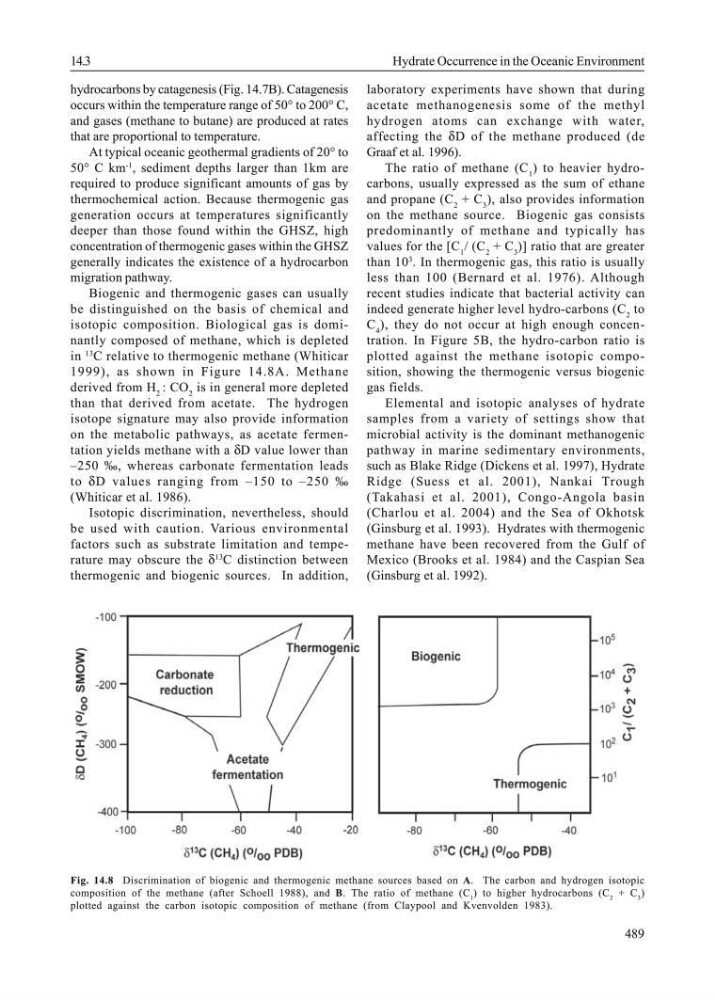
isotopic composition. Biological gas is dominantly composed of methane, which is depleted
in
13
C relative to thermogenic methane (Whiticar
1999), as shown in Figure 14.8A. Methane
derived from H 2 : CO 2 is in general more depleted
than that derived from acetate. The hydrogen
isotope signature may also provide information
on the metabolic pathways, as acetate fermentation yields methane with a δD value lower than
–250 ‰, whereas carbonate fermentation leads
to δD values ranging from –150 to –250 ‰
(Whiticar et al. 1986).
Isotopic discrimination, nevertheless, should
be used with caution. Various environmental
factors such as substrate limitation and temperature may obscure the δ
13
C distinction between
thermogenic and biogenic sources. In addition,
laboratory experiments have shown that during
acetate methanogenesis some of the methyl
hydrogen atoms can exchange with water,
affecting the δD of the methane produced (de
Graaf et al. 1996).
The ratio of methane (C 1 ) to heavier hydrocarbons, usually expressed as the sum of ethane
and propane (C 2 + C 3 ), also provides information
on the methane source. Biogenic gas consists
predominantly of methane and typically has
values for the [C 1 / (C 2 + C 3 )] ratio that are greater
than 10
3
. In thermogenic gas, this ratio is usually
less than 100 (Bernard et al. 1976). Although
recent studies indicate that bacterial activity can
indeed generate higher level hydro-carbons (C 2 to
C 4 ), they do not occur at high enough concentration. In Figure 5B, the hydro-carbon ratio is
plotted against the methane isotopic composition, showing the thermogenic versus biogenic
gas fields.
Elemental and isotopic analyses of hydrate
samples from a variety of settings show that
microbial activity is the dominant methanogenic
pathway in marine sedimentary environments,
such as Blake Ridge (Dickens et al. 1997), Hydrate
Ridge (Suess et al. 2001), Nankai Trough
(Takahasi et al. 2001), Congo-Angola basin
(Charlou et al. 2004) and the Sea of Okhotsk
(Ginsburg et al. 1993). Hydrates with thermogenic
methane have been recovered from the Gulf of
Mexico (Brooks et al. 1984) and the Caspian Sea
(Ginsburg et al. 1992).
Fig. 14.8 Discrimination of biogenic and thermogenic methane sources based on A. The carbon and hydrogen isotopic
composition of the methane (after Schoell 1988), and B. The ratio of methane (C 1 ) to higher hydrocarbons (C 2 + C 3 )
plotted against the carbon isotopic composition of methane (from Claypool and Kvenvolden 1983).
14.3
Hydrate Occurrence in the Oceanic Environment
hydrocarbons by catagenesis (Fig. 14.7B). Catagenesis
occurs within the temperature range of 50° to 200° C,
and gases (methane to butane) are produced at rates
that are proportional to temperature.
At typical oceanic geothermal gradients of 20° to
50° C km
-1
, sediment depths larger than 1km are
required to produce significant amounts of gas by
thermochemical action. Because thermogenic gas
generation occurs at temperatures significantly
deeper than those found within the GHSZ, high
concentration of thermogenic gases within the GHSZ
generally indicates the existence of a hydrocarbon
migration pathway.
Biogenic and thermogenic gases can usually
be distinguished on the basis of chemical and
isotopic composition. Biological gas is dominantly composed of methane, which is depleted
in
13
C relative to thermogenic methane (Whiticar
1999), as shown in Figure 14.8A. Methane
derived from H 2 : CO 2 is in general more depleted
than that derived from acetate. The hydrogen
isotope signature may also provide information
on the metabolic pathways, as acetate fermentation yields methane with a δD value lower than
–250 ‰, whereas carbonate fermentation leads
to δD values ranging from –150 to –250 ‰
(Whiticar et al. 1986).
Isotopic discrimination, nevertheless, should
be used with caution. Various environmental
factors such as substrate limitation and temperature may obscure the δ
13
C distinction between
thermogenic and biogenic sources. In addition,
laboratory experiments have shown that during
acetate methanogenesis some of the methyl
hydrogen atoms can exchange with water,
affecting the δD of the methane produced (de
Graaf et al. 1996).
The ratio of methane (C 1 ) to heavier hydrocarbons, usually expressed as the sum of ethane
and propane (C 2 + C 3 ), also provides information
on the methane source. Biogenic gas consists
predominantly of methane and typically has
values for the [C 1 / (C 2 + C 3 )] ratio that are greater
than 10
3
. In thermogenic gas, this ratio is usually
less than 100 (Bernard et al. 1976). Although
recent studies indicate that bacterial activity can
indeed generate higher level hydro-carbons (C 2 to
C 4 ), they do not occur at high enough concentration. In Figure 5B, the hydro-carbon ratio is
plotted against the methane isotopic composition, showing the thermogenic versus biogenic
gas fields.
Elemental and isotopic analyses of hydrate
samples from a variety of settings show that
microbial activity is the dominant methanogenic
pathway in marine sedimentary environments,
such as Blake Ridge (Dickens et al. 1997), Hydrate
Ridge (Suess et al. 2001), Nankai Trough
(Takahasi et al. 2001), Congo-Angola basin
(Charlou et al. 2004) and the Sea of Okhotsk
(Ginsburg et al. 1993). Hydrates with thermogenic
methane have been recovered from the Gulf of
Mexico (Brooks et al. 1984) and the Caspian Sea
(Ginsburg et al. 1992).
Fig. 14.8 Discrimination of biogenic and thermogenic methane sources based on A. The carbon and hydrogen isotopic
composition of the methane (after Schoell 1988), and B. The ratio of methane (C 1 ) to higher hydrocarbons (C 2 + C 3 )
plotted against the carbon isotopic composition of methane (from Claypool and Kvenvolden 1983).
14.3
Hydrate Occurrence in the Oceanic Environment