

12 Quantification and Regionalization of Benthic Reflux
448
sediment accumulation rate by relating oxygen
depletion to the burial rate of organic carbon
compounds (Fig. 12.16; Section 12.3.3). The accumulation rate was estimated based on different
data sets from carbonate-rich (e.g. the Atlantic
Ocean) and carbonate-poor regions (e.g. the
Pacific Ocean). The calculation of oxygen fluxes
by this simple method merely produced a maximum
deviation from real values by a factor of 2.
The result obtained from regression between
single measurements and the control parameters
was then used for extrapolation. Global oxygen
consumption could be reliably estimated for the
first time on a 2° grid encompassing many regions
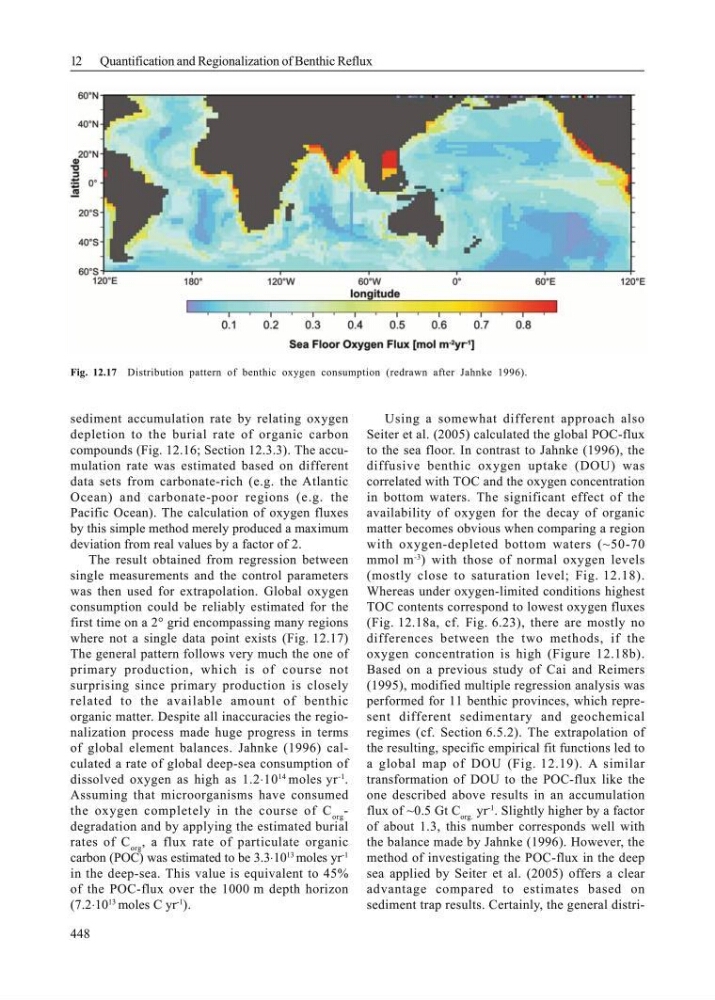
where not a single data point exists (Fig. 12.17)
The general pattern follows very much the one of
primary production, which is of course not
surprising since primary production is closely
related to the available amount of benthic
organic matter. Despite all inaccuracies the regionalization process made huge progress in terms
of global element balances. Jahnke (1996) calculated a rate of global deep-sea consumption of
dissolved oxygen as high as 1.2⋅10
14
moles yr
-1
.
Assuming that microorganisms have consumed
the oxygen completely in the course of C org -
degradation and by applying the estimated burial
rates of C org , a flux rate of particulate organic
carbon (POC) was estimated to be 3.3⋅10
13
moles yr
-1
in the deep-sea. This value is equivalent to 45%
of the POC-flux over the 1000 m depth horizon
(7.2⋅10
13
moles C yr
-1
).
Using a somewhat different approach also
Seiter et al. (2005) calculated the global POC-flux
to the sea floor. In contrast to Jahnke (1996), the
diffusive benthic oxygen uptake (DOU) was
correlated with TOC and the oxygen concentration
in bottom waters. The significant effect of the
availability of oxygen for the decay of organic
matter becomes obvious when comparing a region
with oxygen-depleted bottom waters (~50-70
mmol m
-3
) with those of normal oxygen levels
(mostly close to saturation level; Fig. 12.18).
Whereas under oxygen-limited conditions highest
TOC contents correspond to lowest oxygen fluxes
(Fig. 12.18a, cf. Fig. 6.23), there are mostly no
differences between the two methods, if the
oxygen concentration is high (Figure 12.18b).
Based on a previous study of Cai and Reimers
(1995), modified multiple regression analysis was
performed for 11 benthic provinces, which represent different sedimentary and geochemical
regimes (cf. Section 6.5.2). The extrapolation of
the resulting, specific empirical fit functions led to
a global map of DOU (Fig. 12.19). A similar
transformation of DOU to the POC-flux like the
one described above results in an accumulation
flux of ~0.5 Gt C org. yr
-1
. Slightly higher by a factor
of about 1.3, this number corresponds well with
the balance made by Jahnke (1996). However, the
method of investigating the POC-flux in the deep
sea applied by Seiter et al. (2005) offers a clear
advantage compared to estimates based on
sediment trap results. Certainly, the general distriFig. 12.17 Distribution pattern of benthic oxygen consumption (redrawn after Jahnke 1996).
448
sediment accumulation rate by relating oxygen
depletion to the burial rate of organic carbon
compounds (Fig. 12.16; Section 12.3.3). The accumulation rate was estimated based on different
data sets from carbonate-rich (e.g. the Atlantic
Ocean) and carbonate-poor regions (e.g. the
Pacific Ocean). The calculation of oxygen fluxes
by this simple method merely produced a maximum
deviation from real values by a factor of 2.
The result obtained from regression between
single measurements and the control parameters
was then used for extrapolation. Global oxygen
consumption could be reliably estimated for the
first time on a 2° grid encompassing many regions
where not a single data point exists (Fig. 12.17)
The general pattern follows very much the one of
primary production, which is of course not
surprising since primary production is closely
related to the available amount of benthic
organic matter. Despite all inaccuracies the regionalization process made huge progress in terms
of global element balances. Jahnke (1996) calculated a rate of global deep-sea consumption of
dissolved oxygen as high as 1.2⋅10
14
moles yr
-1
.
Assuming that microorganisms have consumed
the oxygen completely in the course of C org -
degradation and by applying the estimated burial
rates of C org , a flux rate of particulate organic
carbon (POC) was estimated to be 3.3⋅10
13
moles yr
-1
in the deep-sea. This value is equivalent to 45%
of the POC-flux over the 1000 m depth horizon
(7.2⋅10
13
moles C yr
-1
).
Using a somewhat different approach also
Seiter et al. (2005) calculated the global POC-flux
to the sea floor. In contrast to Jahnke (1996), the
diffusive benthic oxygen uptake (DOU) was
correlated with TOC and the oxygen concentration
in bottom waters. The significant effect of the
availability of oxygen for the decay of organic
matter becomes obvious when comparing a region
with oxygen-depleted bottom waters (~50-70
mmol m
-3
) with those of normal oxygen levels
(mostly close to saturation level; Fig. 12.18).
Whereas under oxygen-limited conditions highest
TOC contents correspond to lowest oxygen fluxes
(Fig. 12.18a, cf. Fig. 6.23), there are mostly no
differences between the two methods, if the
oxygen concentration is high (Figure 12.18b).
Based on a previous study of Cai and Reimers
(1995), modified multiple regression analysis was
performed for 11 benthic provinces, which represent different sedimentary and geochemical
regimes (cf. Section 6.5.2). The extrapolation of
the resulting, specific empirical fit functions led to
a global map of DOU (Fig. 12.19). A similar
transformation of DOU to the POC-flux like the
one described above results in an accumulation
flux of ~0.5 Gt C org. yr
-1
. Slightly higher by a factor
of about 1.3, this number corresponds well with
the balance made by Jahnke (1996). However, the
method of investigating the POC-flux in the deep
sea applied by Seiter et al. (2005) offers a clear
advantage compared to estimates based on
sediment trap results. Certainly, the general distriFig. 12.17 Distribution pattern of benthic oxygen consumption (redrawn after Jahnke 1996).