

12 Quantification and Regionalization of Benthic Reflux
446
2002). The Rivers Niger and Zaire, two of the largest streams worldwide discharge into the northern Angola Basin where they release tremendous amounts of dissolved and particulate substance (compare with Fig. 1.2). As outlined above
(Sect. 12.3.3) the solubility of opal decreases when
the proportion of aluminiferous lithogenic detritus
increases (e.g. Van Cappellen and Qui 1997; Dixit
et al. 2001). The high opal content in the
sediments of river estuaries should therefore
result from an effective preservation of amorphous silicates. With greater distance from equatorial upwelling, it should also be considered that
remineralization processes in the water column
may be more intense as described by generalizing
transfer functions (cf. Fig. 6.3), which leads to a
reduction of specific accumulation rates. Hence,
both increased dissolution prior to deposition,
and a reduced dissolution after deposition are
probably the main reasons for the low benthic
silicon release.
The sedimentary environment of the Argentine
Basin is largely controlled by powerful current
systems and intense gravitational mass transport
(Ledbetter and Klaus 1987). Sinking particles, or
particles already deposited, are subjected to a
lateral drift over wide passages, or become resuspended (compare with Section 12.3.2). This
results in a relatively low accumulation of
biogenic material on the shelf. Particularly light
organic compounds are subject to winnowing and
accumulate further downslope (focusing). Thus,
high productivity is still reflected in this area,
however, with a strong horizontal offset towards
the deep sea. This effect is additionally enhanced
by the import of altered biogenic opal from the
Southern Ocean, transported northwards by the
Antarctic Bottom Water (AABW).
What are the conclusions, to be drawn from this
kind of regionalization? Figure 12.14b shows
that approximately 80% of the total release occurs
in the predominately oligotrophic open ocean.
The balance for the South Atlantic (>1000m
water depth) revealed a silicon recycling rate of
2.1⋅10
12
moles Si yr
-1
. Assuming that the area
under study specifies a representative part of the
world’s oceans, the global release rate may be
extrapolated up to a value of 1.95⋅10
13
moles Si yr
-1
(Hensen et al. 1998; Tab 12.2). These rough
approximations probably underestimate the real
flux rate, since opal-rich sediments from the
Southern Ocean and the equatorial Pacific are not
realistically taken into account (cf. Section 12.5.3).
In all cases, these rough balances demonstrate
that the benthic reflux of silicon outweighs the
import by rivers and streams by a factor of 3
(7.3⋅10
12
moles Si yr
-1
, Wollast and Mackenzie
Fig. 12.15 Simplified structure and flux rates of the marine
silicon cycle as resulting from the application of a prognostic, coupled water column-sediment, global biogeochemical
ocean general circulation model. For comparison, flux values
given in brackets base on field observations and were calculated by Tréguer et al. 1995 (after Heinze et al. 2003).
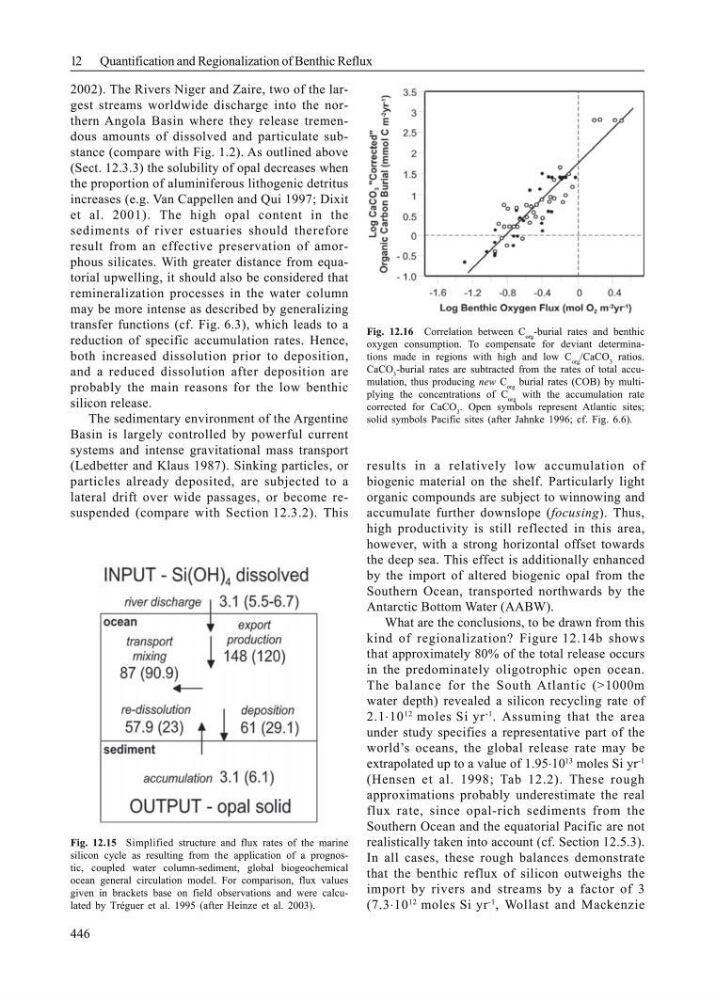
Fig. 12.16 Correlation between C org -burial rates and benthic
oxygen consumption. To compensate for deviant determinations made in regions with high and low C org /CaCO 3 ratios.
CaCO 3 -burial rates are subtracted from the rates of total accumulation, thus producing new C org burial rates (COB) by multiplying the concentrations of C org with the accumulation rate
corrected for CaCO 3 . Open symbols represent Atlantic sites;
solid symbols Pacific sites (after Jahnke 1996; cf. Fig. 6.6).
446
2002). The Rivers Niger and Zaire, two of the largest streams worldwide discharge into the northern Angola Basin where they release tremendous amounts of dissolved and particulate substance (compare with Fig. 1.2). As outlined above
(Sect. 12.3.3) the solubility of opal decreases when
the proportion of aluminiferous lithogenic detritus
increases (e.g. Van Cappellen and Qui 1997; Dixit
et al. 2001). The high opal content in the
sediments of river estuaries should therefore
result from an effective preservation of amorphous silicates. With greater distance from equatorial upwelling, it should also be considered that
remineralization processes in the water column
may be more intense as described by generalizing
transfer functions (cf. Fig. 6.3), which leads to a
reduction of specific accumulation rates. Hence,
both increased dissolution prior to deposition,
and a reduced dissolution after deposition are
probably the main reasons for the low benthic
silicon release.
The sedimentary environment of the Argentine
Basin is largely controlled by powerful current
systems and intense gravitational mass transport
(Ledbetter and Klaus 1987). Sinking particles, or
particles already deposited, are subjected to a
lateral drift over wide passages, or become resuspended (compare with Section 12.3.2). This
results in a relatively low accumulation of
biogenic material on the shelf. Particularly light
organic compounds are subject to winnowing and
accumulate further downslope (focusing). Thus,
high productivity is still reflected in this area,
however, with a strong horizontal offset towards
the deep sea. This effect is additionally enhanced
by the import of altered biogenic opal from the
Southern Ocean, transported northwards by the
Antarctic Bottom Water (AABW).
What are the conclusions, to be drawn from this
kind of regionalization? Figure 12.14b shows
that approximately 80% of the total release occurs
in the predominately oligotrophic open ocean.
The balance for the South Atlantic (>1000m
water depth) revealed a silicon recycling rate of
2.1⋅10
12
moles Si yr
-1
. Assuming that the area
under study specifies a representative part of the
world’s oceans, the global release rate may be
extrapolated up to a value of 1.95⋅10
13
moles Si yr
-1
(Hensen et al. 1998; Tab 12.2). These rough
approximations probably underestimate the real
flux rate, since opal-rich sediments from the
Southern Ocean and the equatorial Pacific are not
realistically taken into account (cf. Section 12.5.3).
In all cases, these rough balances demonstrate
that the benthic reflux of silicon outweighs the
import by rivers and streams by a factor of 3
(7.3⋅10
12
moles Si yr
-1
, Wollast and Mackenzie
Fig. 12.15 Simplified structure and flux rates of the marine
silicon cycle as resulting from the application of a prognostic, coupled water column-sediment, global biogeochemical
ocean general circulation model. For comparison, flux values
given in brackets base on field observations and were calculated by Tréguer et al. 1995 (after Heinze et al. 2003).
Fig. 12.16 Correlation between C org -burial rates and benthic
oxygen consumption. To compensate for deviant determinations made in regions with high and low C org /CaCO 3 ratios.
CaCO 3 -burial rates are subtracted from the rates of total accumulation, thus producing new C org burial rates (COB) by multiplying the concentrations of C org with the accumulation rate
corrected for CaCO 3 . Open symbols represent Atlantic sites;
solid symbols Pacific sites (after Jahnke 1996; cf. Fig. 6.6).