

12 Quantification and Regionalization of Benthic Reflux
444
tool for handling and processing nearly unlimited
amount of different types of data. Based on the
background of a more or less internal data bank management system (DBMS), their main advantage is
the possibility of comparison and combination of
different information levels to determine structural
relationships between all types of data. As a possible result, new structures with formerly unknown
characteristics can be developed.
Apart from locally confined data, such as the
benthic fluxes at definite locations, most GIS
programs process grid data or vector data. One
example for grid data are the already mentioned
remote sensing data of pigment distribution in the
surface water, or the ice cover of the ocean which
is currently recorded by the Coastal Zone Color
Scanner of the NASA or the earth-orbiting NOAAsatelites (cf. Section 12.3.1). These data are
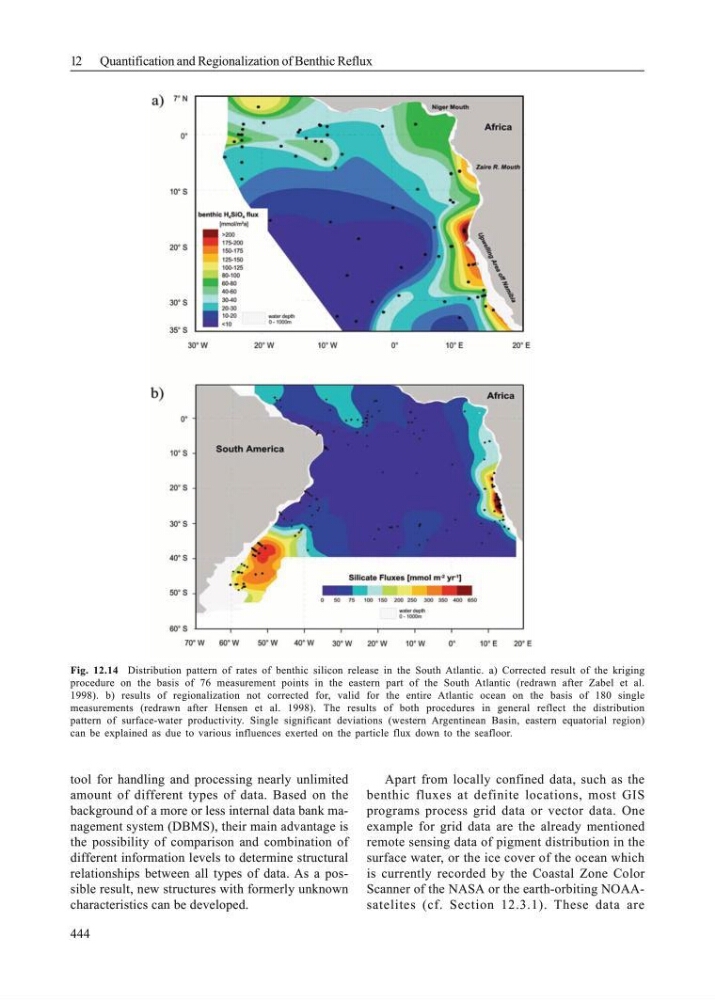
Fig. 12.14 Distribution pattern of rates of benthic silicon release in the South Atlantic. a) Corrected result of the kriging
procedure on the basis of 76 measurement points in the eastern part of the South Atlantic (redrawn after Zabel et al.
1998). b) results of regionalization not corrected for, valid for the entire Atlantic ocean on the basis of 180 single
measurements (redrawn after Hensen et al. 1998). The results of both procedures in general reflect the distribution
pattern of surface-water productivity. Single significant deviations (western Argentinean Basin, eastern equatorial region)
can be explained as due to various influences exerted on the particle flux down to the seafloor.
444
tool for handling and processing nearly unlimited
amount of different types of data. Based on the
background of a more or less internal data bank management system (DBMS), their main advantage is
the possibility of comparison and combination of
different information levels to determine structural
relationships between all types of data. As a possible result, new structures with formerly unknown
characteristics can be developed.
Apart from locally confined data, such as the
benthic fluxes at definite locations, most GIS
programs process grid data or vector data. One
example for grid data are the already mentioned
remote sensing data of pigment distribution in the
surface water, or the ice cover of the ocean which
is currently recorded by the Coastal Zone Color
Scanner of the NASA or the earth-orbiting NOAAsatelites (cf. Section 12.3.1). These data are
Fig. 12.14 Distribution pattern of rates of benthic silicon release in the South Atlantic. a) Corrected result of the kriging
procedure on the basis of 76 measurement points in the eastern part of the South Atlantic (redrawn after Zabel et al.
1998). b) results of regionalization not corrected for, valid for the entire Atlantic ocean on the basis of 180 single
measurements (redrawn after Hensen et al. 1998). The results of both procedures in general reflect the distribution
pattern of surface-water productivity. Single significant deviations (western Argentinean Basin, eastern equatorial region)
can be explained as due to various influences exerted on the particle flux down to the seafloor.