

443
12.4
Conceptual Approaches and Methods for Regional Balancing
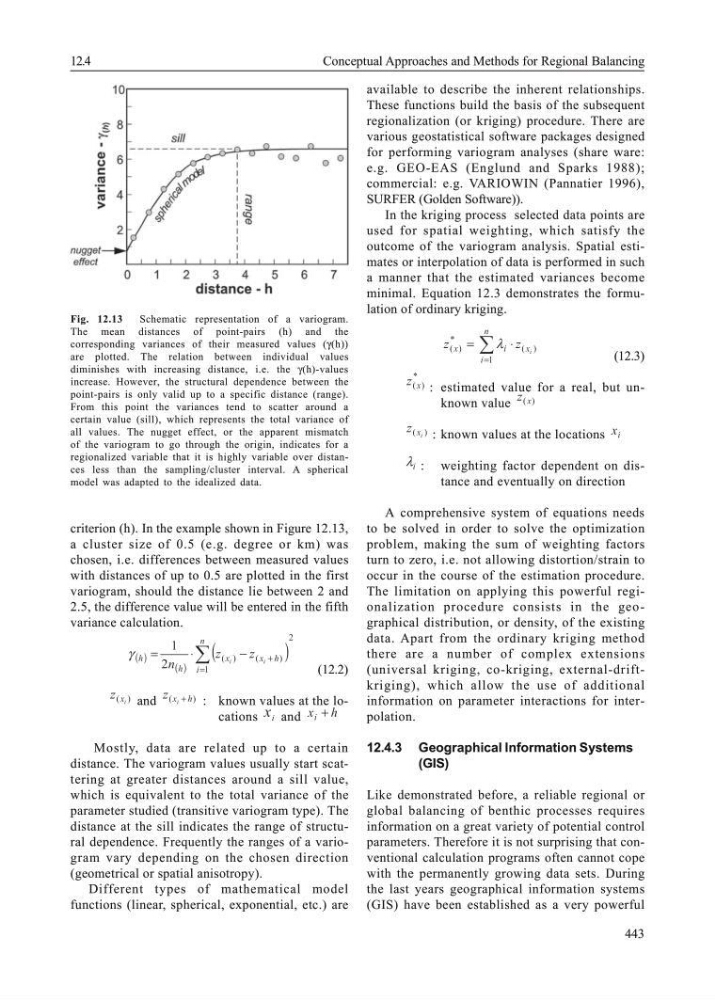
criterion (h). In the example shown in Figure 12.13,
a cluster size of 0.5 (e.g. degree or km) was
chosen, i.e. differences between measured values
with distances of up to 0.5 are plotted in the first
variogram, should the distance lie between 2 and
2.5, the difference value will be entered in the fifth
variance calculation.
( )
( )
(
)
2
1
)
(
)
(
2
1
∑
=
+
−
⋅
=
n
i
h
x
x
h
h
i
i
z
z
n
γ
(12.2)
)
( i
x
z
and
)
(
h
x i
z + : known values at the locations x i and
h
x i +
Mostly, data are related up to a certain
distance. The variogram values usually start scattering at greater distances around a sill value,
which is equivalent to the total variance of the
parameter studied (transitive variogram type). The
distance at the sill indicates the range of structural dependence. Frequently the ranges of a variogram vary depending on the chosen direction
(geometrical or spatial anisotropy).
Different types of mathematical model
functions (linear, spherical, exponential, etc.) are
available to describe the inherent relationships.
These functions build the basis of the subsequent
regionalization (or kriging) procedure. There are
various geostatistical software packages designed
for performing variogram analyses (share ware:
e.g. GEO-EAS (Englund and Sparks 1988);
commercial: e.g. VARIOWIN (Pannatier 1996),
SURFER (Golden Software)).
In the kriging process selected data points are
used for spatial weighting, which satisfy the
outcome of the variogram analysis. Spatial estimates or interpolation of data is performed in such
a manner that the estimated variances become
minimal. Equation 12.3 demonstrates the formulation of ordinary kriging.
∑
=
⋅
=
n
i
x
i
x
i
z
z
1
)
(
*
)
(
λ
(12.3)
*
)
( x
z : estimated value for a real, but unknown value
)
( x
z
)
( i
x
z
: known values at the locations i
x
i
λ : weighting factor dependent on distance and eventually on direction
A comprehensive system of equations needs
to be solved in order to solve the optimization
problem, making the sum of weighting factors
turn to zero, i.e. not allowing distortion/strain to
occur in the course of the estimation procedure.
The limitation on applying this powerful regionalization procedure consists in the geographical distribution, or density, of the existing
data. Apart from the ordinary kriging method
there are a number of complex extensions
(universal kriging, co-kriging, external-driftkriging), which allow the use of additional
information on parameter interactions for interpolation.
12.4.3 Geographical Information Systems
(GIS)
Like demonstrated before, a reliable regional or
global balancing of benthic processes requires
information on a great variety of potential control
parameters. Therefore it is not surprising that conventional calculation programs often cannot cope
with the permanently growing data sets. During
the last years geographical information systems
(GIS) have been established as a very powerful
Fig. 12.13
Schematic representation of a variogram.
The mean distances of point-pairs (h) and the
corresponding variances of their measured values (γ(h))
are plotted. The relation between individual values
diminishes with increasing distance, i.e. the γ(h)-values
increase. However, the structural dependence between the
point-pairs is only valid up to a specific distance (range).
From this point the variances tend to scatter around a
certain value (sill), which represents the total variance of
all values. The nugget effect, or the apparent mismatch
of the variogram to go through the origin, indicates for a
regionalized variable that it is highly variable over distances less than the sampling/cluster interval. A spherical
model was adapted to the idealized data.
12.4
Conceptual Approaches and Methods for Regional Balancing
criterion (h). In the example shown in Figure 12.13,
a cluster size of 0.5 (e.g. degree or km) was
chosen, i.e. differences between measured values
with distances of up to 0.5 are plotted in the first
variogram, should the distance lie between 2 and
2.5, the difference value will be entered in the fifth
variance calculation.
( )
( )
(
)
2
1
)
(
)
(
2
1
∑
=
+
−
⋅
=
n
i
h
x
x
h
h
i
i
z
z
n
γ
(12.2)
)
( i
x
z
and
)
(
h
x i
z + : known values at the locations x i and
h
x i +
Mostly, data are related up to a certain
distance. The variogram values usually start scattering at greater distances around a sill value,
which is equivalent to the total variance of the
parameter studied (transitive variogram type). The
distance at the sill indicates the range of structural dependence. Frequently the ranges of a variogram vary depending on the chosen direction
(geometrical or spatial anisotropy).
Different types of mathematical model
functions (linear, spherical, exponential, etc.) are
available to describe the inherent relationships.
These functions build the basis of the subsequent
regionalization (or kriging) procedure. There are
various geostatistical software packages designed
for performing variogram analyses (share ware:
e.g. GEO-EAS (Englund and Sparks 1988);
commercial: e.g. VARIOWIN (Pannatier 1996),
SURFER (Golden Software)).
In the kriging process selected data points are
used for spatial weighting, which satisfy the
outcome of the variogram analysis. Spatial estimates or interpolation of data is performed in such
a manner that the estimated variances become
minimal. Equation 12.3 demonstrates the formulation of ordinary kriging.
∑
=
⋅
=
n
i
x
i
x
i
z
z
1
)
(
*
)
(
λ
(12.3)
*
)
( x
z : estimated value for a real, but unknown value
)
( x
z
)
( i
x
z
: known values at the locations i
x
i
λ : weighting factor dependent on distance and eventually on direction
A comprehensive system of equations needs
to be solved in order to solve the optimization
problem, making the sum of weighting factors
turn to zero, i.e. not allowing distortion/strain to
occur in the course of the estimation procedure.
The limitation on applying this powerful regionalization procedure consists in the geographical distribution, or density, of the existing
data. Apart from the ordinary kriging method
there are a number of complex extensions
(universal kriging, co-kriging, external-driftkriging), which allow the use of additional
information on parameter interactions for interpolation.
12.4.3 Geographical Information Systems
(GIS)
Like demonstrated before, a reliable regional or
global balancing of benthic processes requires
information on a great variety of potential control
parameters. Therefore it is not surprising that conventional calculation programs often cannot cope
with the permanently growing data sets. During
the last years geographical information systems
(GIS) have been established as a very powerful
Fig. 12.13
Schematic representation of a variogram.
The mean distances of point-pairs (h) and the
corresponding variances of their measured values (γ(h))
are plotted. The relation between individual values
diminishes with increasing distance, i.e. the γ(h)-values
increase. However, the structural dependence between the
point-pairs is only valid up to a specific distance (range).
From this point the variances tend to scatter around a
certain value (sill), which represents the total variance of
all values. The nugget effect, or the apparent mismatch
of the variogram to go through the origin, indicates for a
regionalized variable that it is highly variable over distances less than the sampling/cluster interval. A spherical
model was adapted to the idealized data.