

325
9.4.1
Production Versus Dissolution
of Pelagic Carbonates
This chapter summarizes the most recent compilations of carbonate reservoir size in the ocean and
sediments, as well as the particulate and dissolved
fluxes (Fig. 9.5) provided by the above mentioned
authors. Coral reefs are probably the best documented shallow-water carbonate environment.
Carbonate production on reef flats range as high
as 10.000 g CaCO 3 m
-2
yr
-1
, with a global mean of
about 1800 g CaCO 3 m
-2
yr
-1
. Totally this amounts
to 24.5⋅10
12
mol yr
-1
(Table 9.1) from which 14.5⋅10
12
mol yr
-1
accumulate and 10⋅10
12
mol yr
-1
are
transported to the deep-sea either by particulate
or dissolved export. One of the most uncertain
numbers in all these budget calculations are the
estimates of the global carbonate production in
the open ocean. Milliman’s (1993) estimate was
only about 24⋅10
12
mol yr
-1
, based on carbonate
flux rates at about 1000 m water depth, measured
by long-term time series of sediment trap moorings, which is approximately 8 g CaCO 3 m
-2
yr
-1
accounting for a global flux rate of particulate pelagic carbonate to be in the range of 24⋅10
12
mol yr
-1
.
However, as discussed in Wollast (1994), in order
to produce the measured water column profiles of
total inorganic carbon and carbonate alkalinity
(Fig. 9.3) a much higher surface ocean carbonate
production is required. Thus estimates reported
more recently are in the order of 60 to 90⋅10
12
mol yr
-1
(Table 9.6). The discrepancy between the very
high global production rates and measured fluxes
obtained in sediment traps then can only be
explained if one accepts that a substantial portion
(30 to 50 %) of carbonate produced in the pelagic
Model of seawater at 6000 m depth
input concentrations:
model calculation of cold surface seawater
boundary conditions:
temperature
2 °C
pCO 2
280 µatm
(i.e. log pCO 2 = -3.55)
log k calcite
-7.75
(at 2 °C and 600 atm pressure)
input situation without calcite-carbonate-equilibrium:
pH
8.23
sum of carbonate species (TIC)
2.28 mmol/l
sum of calcium species
10.63 mmol/l
Si calcite
0.43
(i.e. Ω calcite = 2.7)
no reactions, but pressure changed to 600 atm
PHREEQC model results:
pH
8.23
sum of carbonate species (TIC)
2.28 mmol/l
sum of calcium species
10.63 mmol/l
Si calcite
-0.16
(i.e. Ω calcite = 0.7)
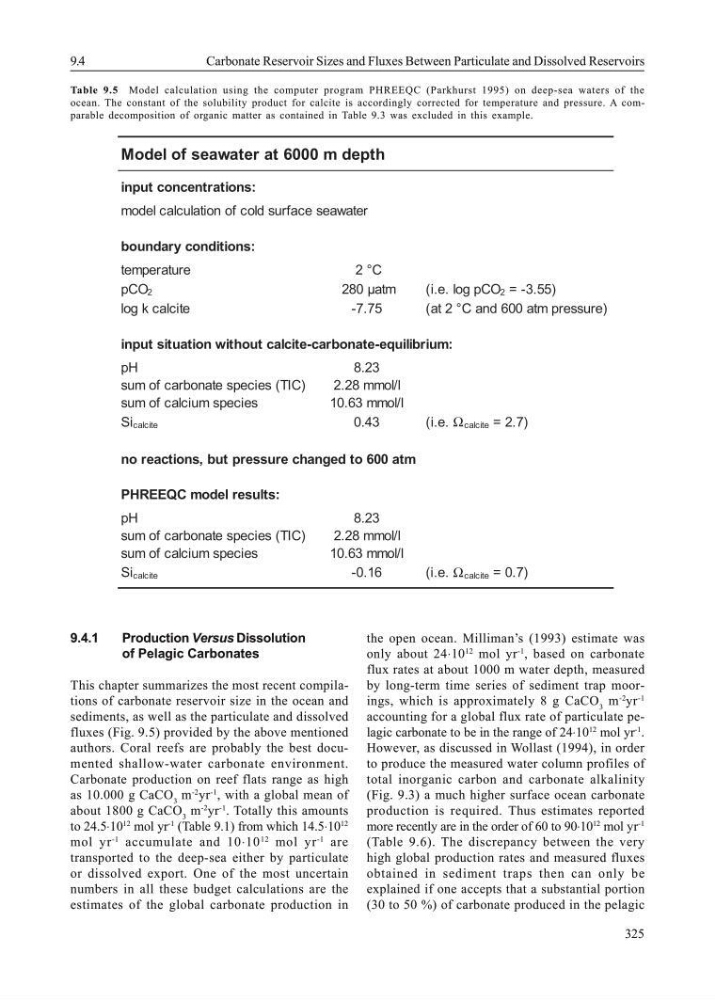
Table 9.5 Model calculation using the computer program PHREEQC (Parkhurst 1995) on deep-sea waters of the
ocean. The constant of the solubility product for calcite is accordingly corrected for temperature and pressure. A comparable decomposition of organic matter as contained in Table 9.3 was excluded in this example.
9.4
Carbonate Reservoir Sizes and Fluxes Between Particulate and Dissolved Reservoirs
9.4.1
Production Versus Dissolution
of Pelagic Carbonates
This chapter summarizes the most recent compilations of carbonate reservoir size in the ocean and
sediments, as well as the particulate and dissolved
fluxes (Fig. 9.5) provided by the above mentioned
authors. Coral reefs are probably the best documented shallow-water carbonate environment.
Carbonate production on reef flats range as high
as 10.000 g CaCO 3 m
-2
yr
-1
, with a global mean of
about 1800 g CaCO 3 m
-2
yr
-1
. Totally this amounts
to 24.5⋅10
12
mol yr
-1
(Table 9.1) from which 14.5⋅10
12
mol yr
-1
accumulate and 10⋅10
12
mol yr
-1
are
transported to the deep-sea either by particulate
or dissolved export. One of the most uncertain
numbers in all these budget calculations are the
estimates of the global carbonate production in
the open ocean. Milliman’s (1993) estimate was
only about 24⋅10
12
mol yr
-1
, based on carbonate
flux rates at about 1000 m water depth, measured
by long-term time series of sediment trap moorings, which is approximately 8 g CaCO 3 m
-2
yr
-1
accounting for a global flux rate of particulate pelagic carbonate to be in the range of 24⋅10
12
mol yr
-1
.
However, as discussed in Wollast (1994), in order
to produce the measured water column profiles of
total inorganic carbon and carbonate alkalinity
(Fig. 9.3) a much higher surface ocean carbonate
production is required. Thus estimates reported
more recently are in the order of 60 to 90⋅10
12
mol yr
-1
(Table 9.6). The discrepancy between the very
high global production rates and measured fluxes
obtained in sediment traps then can only be
explained if one accepts that a substantial portion
(30 to 50 %) of carbonate produced in the pelagic
Model of seawater at 6000 m depth
input concentrations:
model calculation of cold surface seawater
boundary conditions:
temperature
2 °C
pCO 2
280 µatm
(i.e. log pCO 2 = -3.55)
log k calcite
-7.75
(at 2 °C and 600 atm pressure)
input situation without calcite-carbonate-equilibrium:
pH
8.23
sum of carbonate species (TIC)
2.28 mmol/l
sum of calcium species
10.63 mmol/l
Si calcite
0.43
(i.e. Ω calcite = 2.7)
no reactions, but pressure changed to 600 atm
PHREEQC model results:
pH
8.23
sum of carbonate species (TIC)
2.28 mmol/l
sum of calcium species
10.63 mmol/l
Si calcite
-0.16
(i.e. Ω calcite = 0.7)
Table 9.5 Model calculation using the computer program PHREEQC (Parkhurst 1995) on deep-sea waters of the
ocean. The constant of the solubility product for calcite is accordingly corrected for temperature and pressure. A comparable decomposition of organic matter as contained in Table 9.3 was excluded in this example.
9.4
Carbonate Reservoir Sizes and Fluxes Between Particulate and Dissolved Reservoirs