

321
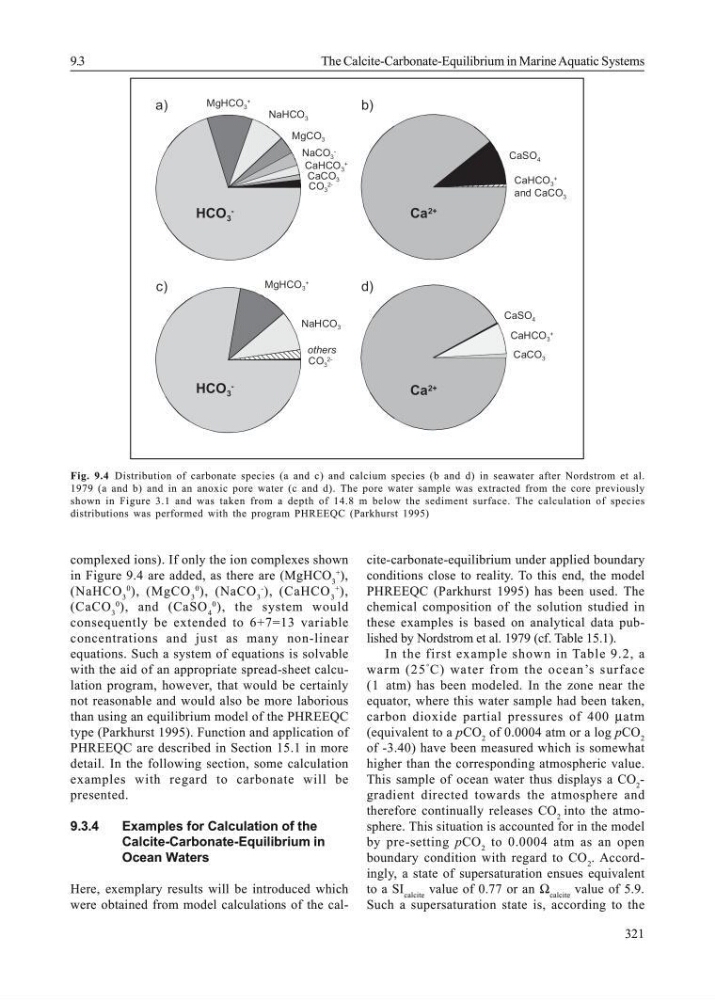
complexed ions). If only the ion complexes shown
in Figure 9.4 are added, as there are (MgHCO 3
+
),
(NaHCO 3
0
), (MgCO 3
0
), (NaCO 3
-
), (CaHCO 3
+
),
(CaCO 3
0
), and (CaSO 4
0
), the system would
consequently be extended to 6+7=13 variable
concentrations and just as many non-linear
equations. Such a system of equations is solvable
with the aid of an appropriate spread-sheet calculation program, however, that would be certainly
not reasonable and would also be more laborious
than using an equilibrium model of the PHREEQC
type (Parkhurst 1995). Function and application of
PHREEQC are described in Section 15.1 in more
detail. In the following section, some calculation
examples with regard to carbonate will be
presented.
9.3.4
Examples for Calculation of the
Calcite-Carbonate-Equilibrium in
Ocean Waters
Here, exemplary results will be introduced which
were obtained from model calculations of the calcite-carbonate-equilibrium under applied boundary
conditions close to reality. To this end, the model
PHREEQC (Parkhurst 1995) has been used. The
chemical composition of the solution studied in
these examples is based on analytical data published by Nordstrom et al. 1979 (cf. Table 15.1).
In the first example shown in Table 9.2, a
warm (25
°
C) water from the ocean’s surface
(1 atm) has been modeled. In the zone near the
equator, where this water sample had been taken,
carbon dioxide partial pressures of 400 µatm
(equivalent to a pCO 2 of 0.0004 atm or a log pCO 2
of -3.40) have been measured which is somewhat
higher than the corresponding atmospheric value.
This sample of ocean water thus displays a CO 2 -
gradient directed towards the atmosphere and
therefore continually releases CO 2 into the atmosphere. This situation is accounted for in the model
by pre-setting pCO 2 to 0.0004 atm as an open
boundary condition with regard to CO 2 . Accordingly, a state of supersaturation ensues equivalent
to a SI calcite value of 0.77 or an Ω calcite value of 5.9.
Such a supersaturation state is, according to the
MgHCO 3
+
CO 3
2NaHCO 3
MgCO 3
NaCO 3
-
CaHCO 3
+
CaCO 3
HCO 3
-
HCO 3
-
MgHCO 3
+
NaHCO 3
CO 3
2others
Ca 2+
Ca 2+
CaSO 4
CaHCO 3
+
CaCO 3
CaSO 4
CaHCO 3
+
and CaCO 3
a)
b)
c)
d)
Fig. 9.4 Distribution of carbonate species (a and c) and calcium species (b and d) in seawater after Nordstrom et al.
1979 (a and b) and in an anoxic pore water (c and d). The pore water sample was extracted from the core previously
shown in Figure 3.1 and was taken from a depth of 14.8 m below the sediment surface. The calculation of species
distributions was performed with the program PHREEQC (Parkhurst 1995)
9.3
The Calcite-Carbonate-Equilibrium in Marine Aquatic Systems
complexed ions). If only the ion complexes shown
in Figure 9.4 are added, as there are (MgHCO 3
+
),
(NaHCO 3
0
), (MgCO 3
0
), (NaCO 3
-
), (CaHCO 3
+
),
(CaCO 3
0
), and (CaSO 4
0
), the system would
consequently be extended to 6+7=13 variable
concentrations and just as many non-linear
equations. Such a system of equations is solvable
with the aid of an appropriate spread-sheet calculation program, however, that would be certainly
not reasonable and would also be more laborious
than using an equilibrium model of the PHREEQC
type (Parkhurst 1995). Function and application of
PHREEQC are described in Section 15.1 in more
detail. In the following section, some calculation
examples with regard to carbonate will be
presented.
9.3.4
Examples for Calculation of the
Calcite-Carbonate-Equilibrium in
Ocean Waters
Here, exemplary results will be introduced which
were obtained from model calculations of the calcite-carbonate-equilibrium under applied boundary
conditions close to reality. To this end, the model
PHREEQC (Parkhurst 1995) has been used. The
chemical composition of the solution studied in
these examples is based on analytical data published by Nordstrom et al. 1979 (cf. Table 15.1).
In the first example shown in Table 9.2, a
warm (25
°
C) water from the ocean’s surface
(1 atm) has been modeled. In the zone near the
equator, where this water sample had been taken,
carbon dioxide partial pressures of 400 µatm
(equivalent to a pCO 2 of 0.0004 atm or a log pCO 2
of -3.40) have been measured which is somewhat
higher than the corresponding atmospheric value.
This sample of ocean water thus displays a CO 2 -
gradient directed towards the atmosphere and
therefore continually releases CO 2 into the atmosphere. This situation is accounted for in the model
by pre-setting pCO 2 to 0.0004 atm as an open
boundary condition with regard to CO 2 . Accordingly, a state of supersaturation ensues equivalent
to a SI calcite value of 0.77 or an Ω calcite value of 5.9.
Such a supersaturation state is, according to the
MgHCO 3
+
CO 3
2NaHCO 3
MgCO 3
NaCO 3
-
CaHCO 3
+
CaCO 3
HCO 3
-
HCO 3
-
MgHCO 3
+
NaHCO 3
CO 3
2others
Ca 2+
Ca 2+
CaSO 4
CaHCO 3
+
CaCO 3
CaSO 4
CaHCO 3
+
and CaCO 3
a)
b)
c)
d)
Fig. 9.4 Distribution of carbonate species (a and c) and calcium species (b and d) in seawater after Nordstrom et al.
1979 (a and b) and in an anoxic pore water (c and d). The pore water sample was extracted from the core previously
shown in Figure 3.1 and was taken from a depth of 14.8 m below the sediment surface. The calculation of species
distributions was performed with the program PHREEQC (Parkhurst 1995)
9.3
The Calcite-Carbonate-Equilibrium in Marine Aquatic Systems