

8
Sulfur Cycling and Methane Oxidation
280
again with a peak just where sulfate and methane
reached the same molar concentrations (small
insert in Fig. 8.5). At that depth also the anaerobic
oxidation of methane peaked with similar rates as
the sulfate reduction. The integrated rates of
methane oxidation in the transition zone accounted for 89 % of sulfate reduction at this depth.
This example illustrates how bacterial sulfate
reduction changes from organiclastic (based on
the degradation of organic material) to methanotrophic (based on the oxidation of methane) down
through the sediment column.
The pore water gradients of sulfate and
methane and the depth of the AOM zone may vary
strongly among sediments, depending on water
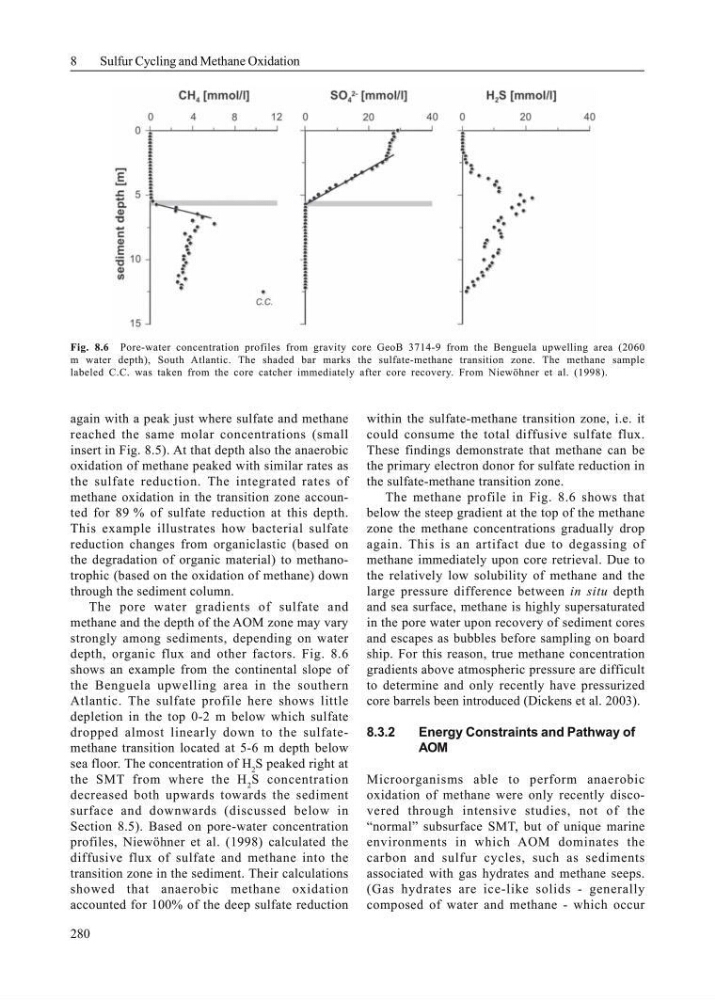
depth, organic flux and other factors. Fig. 8.6
shows an example from the continental slope of
the Benguela upwelling area in the southern
Atlantic. The sulfate profile here shows little
depletion in the top 0-2 m below which sulfate
dropped almost linearly down to the sulfatemethane transition located at 5-6 m depth below
sea floor. The concentration of H 2 S peaked right at
the SMT from where the H 2 S concentration
decreased both upwards towards the sediment
surface and downwards (discussed below in
Section 8.5). Based on pore-water concentration
profiles, Niewöhner et al. (1998) calculated the
diffusive flux of sulfate and methane into the
transition zone in the sediment. Their calculations
showed that anaerobic methane oxidation
accounted for 100% of the deep sulfate reduction
within the sulfate-methane transition zone, i.e. it
could consume the total diffusive sulfate flux.
These findings demonstrate that methane can be
the primary electron donor for sulfate reduction in
the sulfate-methane transition zone.
The methane profile in Fig. 8.6 shows that
below the steep gradient at the top of the methane
zone the methane concentrations gradually drop
again. This is an artifact due to degassing of
methane immediately upon core retrieval. Due to
the relatively low solubility of methane and the
large pressure difference between in situ depth
and sea surface, methane is highly supersaturated
in the pore water upon recovery of sediment cores
and escapes as bubbles before sampling on board
ship. For this reason, true methane concentration
gradients above atmospheric pressure are difficult
to determine and only recently have pressurized
core barrels been introduced (Dickens et al. 2003).
8.3.2
Energy Constraints and Pathway of
AOM
Microorganisms able to perform anaerobic
oxidation of methane were only recently discovered through intensive studies, not of the
“normal” subsurface SMT, but of unique marine
environments in which AOM dominates the
carbon and sulfur cycles, such as sediments
associated with gas hydrates and methane seeps.
(Gas hydrates are ice-like solids - generally
composed of water and methane - which occur
Fig. 8.6 Pore-water concentration profiles from gravity core GeoB 3714-9 from the Benguela upwelling area (2060
m water depth), South Atlantic. The shaded bar marks the sulfate-methane transition zone. The methane sample
labeled C.C. was taken from the core catcher immediately after core recovery. From Niewöhner et al. (1998).
Sulfur Cycling and Methane Oxidation
280
again with a peak just where sulfate and methane
reached the same molar concentrations (small
insert in Fig. 8.5). At that depth also the anaerobic
oxidation of methane peaked with similar rates as
the sulfate reduction. The integrated rates of
methane oxidation in the transition zone accounted for 89 % of sulfate reduction at this depth.
This example illustrates how bacterial sulfate
reduction changes from organiclastic (based on
the degradation of organic material) to methanotrophic (based on the oxidation of methane) down
through the sediment column.
The pore water gradients of sulfate and
methane and the depth of the AOM zone may vary
strongly among sediments, depending on water
depth, organic flux and other factors. Fig. 8.6
shows an example from the continental slope of
the Benguela upwelling area in the southern
Atlantic. The sulfate profile here shows little
depletion in the top 0-2 m below which sulfate
dropped almost linearly down to the sulfatemethane transition located at 5-6 m depth below
sea floor. The concentration of H 2 S peaked right at
the SMT from where the H 2 S concentration
decreased both upwards towards the sediment
surface and downwards (discussed below in
Section 8.5). Based on pore-water concentration
profiles, Niewöhner et al. (1998) calculated the
diffusive flux of sulfate and methane into the
transition zone in the sediment. Their calculations
showed that anaerobic methane oxidation
accounted for 100% of the deep sulfate reduction
within the sulfate-methane transition zone, i.e. it
could consume the total diffusive sulfate flux.
These findings demonstrate that methane can be
the primary electron donor for sulfate reduction in
the sulfate-methane transition zone.
The methane profile in Fig. 8.6 shows that
below the steep gradient at the top of the methane
zone the methane concentrations gradually drop
again. This is an artifact due to degassing of
methane immediately upon core retrieval. Due to
the relatively low solubility of methane and the
large pressure difference between in situ depth
and sea surface, methane is highly supersaturated
in the pore water upon recovery of sediment cores
and escapes as bubbles before sampling on board
ship. For this reason, true methane concentration
gradients above atmospheric pressure are difficult
to determine and only recently have pressurized
core barrels been introduced (Dickens et al. 2003).
8.3.2
Energy Constraints and Pathway of
AOM
Microorganisms able to perform anaerobic
oxidation of methane were only recently discovered through intensive studies, not of the
“normal” subsurface SMT, but of unique marine
environments in which AOM dominates the
carbon and sulfur cycles, such as sediments
associated with gas hydrates and methane seeps.
(Gas hydrates are ice-like solids - generally
composed of water and methane - which occur
Fig. 8.6 Pore-water concentration profiles from gravity core GeoB 3714-9 from the Benguela upwelling area (2060
m water depth), South Atlantic. The shaded bar marks the sulfate-methane transition zone. The methane sample
labeled C.C. was taken from the core catcher immediately after core recovery. From Niewöhner et al. (1998).