

7
The Biogeochemistry of Iron
250
∆G 0 : (-376) - (-228) kJ mol -1
4FeOOH + CH 2 O +7H +
⇒ 4Fe 2+ + HCO 3
- + 6H 2 O
(7.12)
∆G 0 : (-387) - (-239) kJ mol -1
2α-Fe 2 O 3 + CH 2 O + 7H +
⇒ 4Fe 2+ + HCO 3
- + 4H 2 O
(7.13)
∆G 0 : -236 kJ mol -1
2Fe 3 O 4 + CH 2 O + 11H +
⇒ 6Fe 2+ + HCO 3
- + 6H 2 O
(7.14)
∆G 0 : -328 kJ mol -1
∆G
0
values were adopted from Stumm and
Morgan (1996). For Fe(OH) 3 and FeOOH a range
of free energy is given as the solubility products
K s = [Fe
3+
] [OH
-
]
3
range from 10
-37.3
to 10
-43.7
depending on the mode of preparation, age and
molar surface. For example, aged goethite (αFeOOH) reveals a ∆G
0
f
of -489 kJ mol
-1
whereas for
freshly precipitated amorphous FeOOH a value of
-462 kJ mol
-1
was determined (Stumm and Morgan
1996). The variability of FeOOH thermodynamic
properties is a result of the metastability of freshly
precipitated ferric iron phases (chapter 7.4.2.1, Fig.
7.10).
By means of microbial cultures growing on the
various iron oxides as terminal electron acceptors
it has been shown that they all can be used for the
purpose of dissimilation (e.g. Lovley 1991; Kostka
and Nealson 1995). Yet, it was generally found
that the ferric iron phases were reduced at different rates and to varying degrees. Consequently,
Ottow (1969) determined the following sequence
of biological availability: FePO 4 ⋅4H 2 O > Fe(OH) 3 >
lepidocrocite (γ-FeOOH) > goethite (α-FeOOH) >
hematite (Fe 2 O 3 ). Note that the Fe-P phase may
sequester significant amounts of P out of the
nutrient loaded freshwater part of an estuary, but
under brackish and marine conditions this phase
is not stable as it rapidly transforms under the
influence of free sulfide (Hyacinthe and Van
Cappellen, 2004). Within natural soil samples a
preferential reduction of amorphous to crystalline
iron oxides was found (Munch and Ottow 1980).
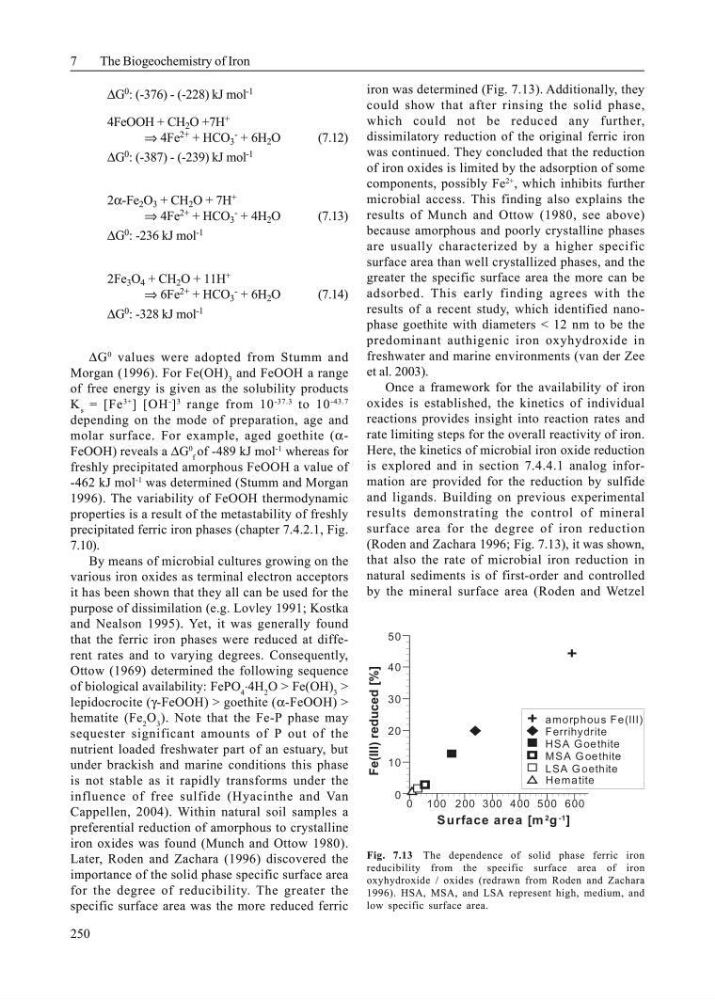
Later, Roden and Zachara (1996) discovered the
importance of the solid phase specific surface area
for the degree of reducibility. The greater the
specific surface area was the more reduced ferric
iron was determined (Fig. 7.13). Additionally, they
could show that after rinsing the solid phase,
which could not be reduced any further,
dissimilatory reduction of the original ferric iron
was continued. They concluded that the reduction
of iron oxides is limited by the adsorption of some
components, possibly Fe
2+
, which inhibits further
microbial access. This finding also explains the
results of Munch and Ottow (1980, see above)
because amorphous and poorly crystalline phases
are usually characterized by a higher specific
surface area than well crystallized phases, and the
greater the specific surface area the more can be
adsorbed. This early finding agrees with the
results of a recent study, which identified nanophase goethite with diameters < 12 nm to be the
predominant authigenic iron oxyhydroxide in
freshwater and marine environments (van der Zee
et al. 2003).
Once a framework for the availability of iron
oxides is established, the kinetics of individual
reactions provides insight into reaction rates and
rate limiting steps for the overall reactivity of iron.
Here, the kinetics of microbial iron oxide reduction
is explored and in section 7.4.4.1 analog information are provided for the reduction by sulfide
and ligands. Building on previous experimental
results demonstrating the control of mineral
surface area for the degree of iron reduction
(Roden and Zachara 1996; Fig. 7.13), it was shown,
that also the rate of microbial iron reduction in
natural sediments is of first-order and controlled
by the mineral surface area (Roden and Wetzel
Fig. 7.13 The dependence of solid phase ferric iron
reducibility from the specific surface area of iron
oxyhydroxide / oxides (redrawn from Roden and Zachara
1996). HSA, MSA, and LSA represent high, medium, and
low specific surface area.
Fe(III) reduced [%]
Surface area [m 2 g -1 ]
100 200 300 400 500 600
0
0
50
40
30
20
10
amorphous Fe(III)
Ferrihydrite
Hematite
HSA G oethite
M SA G oethite
LSA G oethite
The Biogeochemistry of Iron
250
∆G 0 : (-376) - (-228) kJ mol -1
4FeOOH + CH 2 O +7H +
⇒ 4Fe 2+ + HCO 3
- + 6H 2 O
(7.12)
∆G 0 : (-387) - (-239) kJ mol -1
2α-Fe 2 O 3 + CH 2 O + 7H +
⇒ 4Fe 2+ + HCO 3
- + 4H 2 O
(7.13)
∆G 0 : -236 kJ mol -1
2Fe 3 O 4 + CH 2 O + 11H +
⇒ 6Fe 2+ + HCO 3
- + 6H 2 O
(7.14)
∆G 0 : -328 kJ mol -1
∆G
0
values were adopted from Stumm and
Morgan (1996). For Fe(OH) 3 and FeOOH a range
of free energy is given as the solubility products
K s = [Fe
3+
] [OH
-
]
3
range from 10
-37.3
to 10
-43.7
depending on the mode of preparation, age and
molar surface. For example, aged goethite (αFeOOH) reveals a ∆G
0
f
of -489 kJ mol
-1
whereas for
freshly precipitated amorphous FeOOH a value of
-462 kJ mol
-1
was determined (Stumm and Morgan
1996). The variability of FeOOH thermodynamic
properties is a result of the metastability of freshly
precipitated ferric iron phases (chapter 7.4.2.1, Fig.
7.10).
By means of microbial cultures growing on the
various iron oxides as terminal electron acceptors
it has been shown that they all can be used for the
purpose of dissimilation (e.g. Lovley 1991; Kostka
and Nealson 1995). Yet, it was generally found
that the ferric iron phases were reduced at different rates and to varying degrees. Consequently,
Ottow (1969) determined the following sequence
of biological availability: FePO 4 ⋅4H 2 O > Fe(OH) 3 >
lepidocrocite (γ-FeOOH) > goethite (α-FeOOH) >
hematite (Fe 2 O 3 ). Note that the Fe-P phase may
sequester significant amounts of P out of the
nutrient loaded freshwater part of an estuary, but
under brackish and marine conditions this phase
is not stable as it rapidly transforms under the
influence of free sulfide (Hyacinthe and Van
Cappellen, 2004). Within natural soil samples a
preferential reduction of amorphous to crystalline
iron oxides was found (Munch and Ottow 1980).
Later, Roden and Zachara (1996) discovered the
importance of the solid phase specific surface area
for the degree of reducibility. The greater the
specific surface area was the more reduced ferric
iron was determined (Fig. 7.13). Additionally, they
could show that after rinsing the solid phase,
which could not be reduced any further,
dissimilatory reduction of the original ferric iron
was continued. They concluded that the reduction
of iron oxides is limited by the adsorption of some
components, possibly Fe
2+
, which inhibits further
microbial access. This finding also explains the
results of Munch and Ottow (1980, see above)
because amorphous and poorly crystalline phases
are usually characterized by a higher specific
surface area than well crystallized phases, and the
greater the specific surface area the more can be
adsorbed. This early finding agrees with the
results of a recent study, which identified nanophase goethite with diameters < 12 nm to be the
predominant authigenic iron oxyhydroxide in
freshwater and marine environments (van der Zee
et al. 2003).
Once a framework for the availability of iron
oxides is established, the kinetics of individual
reactions provides insight into reaction rates and
rate limiting steps for the overall reactivity of iron.
Here, the kinetics of microbial iron oxide reduction
is explored and in section 7.4.4.1 analog information are provided for the reduction by sulfide
and ligands. Building on previous experimental
results demonstrating the control of mineral
surface area for the degree of iron reduction
(Roden and Zachara 1996; Fig. 7.13), it was shown,
that also the rate of microbial iron reduction in
natural sediments is of first-order and controlled
by the mineral surface area (Roden and Wetzel
Fig. 7.13 The dependence of solid phase ferric iron
reducibility from the specific surface area of iron
oxyhydroxide / oxides (redrawn from Roden and Zachara
1996). HSA, MSA, and LSA represent high, medium, and
low specific surface area.
Fe(III) reduced [%]
Surface area [m 2 g -1 ]
100 200 300 400 500 600
0
0
50
40
30
20
10
amorphous Fe(III)
Ferrihydrite
Hematite
HSA G oethite
M SA G oethite
LSA G oethite