

209
6.2
Distribution of Oxygen, Nitrate and Phosphate in Seawater
which is thought to be caused by entrapment of
air bubbles (cf. Chester 1990). Below the productive mixed layer oxygen is depleted by bacterial
respiration processes. Numerous studies show
that this process is most intense within the upper
1,000 m of the water column, which marks
approximately the lower end of the permanent
thermocline. As a consequence significant oxygen
minimum zones can be observed in areas with high
surface water productivity (see Fig. 4.2). Such
areas exist where upwelling water masses significantly enhance the supply of nutrients, mainly at
the west coasts of the continents (trade wind
belts of America and Africa), but also along the
equatorial divergence zones and related to the
Polar Fronts (e.g. Antoine et al. 1996; Behrenfeld
and Falkowski 1997; see Fig. 12.5). Generally, the
distribution of oxygen in the water column is
dependent on how much the oxygen depletion
exceeds the supply by vertical and lateral advection and diffusion at a certain depth. Since carbon
oxidation is the main reason for oxygen depletion,
a syngenetical increase of dissolved nutrients
(nitrate and phosphate) and a decrease of particulate organic carbon with increasing water depth is
the typical feature. Figure 6.1 shows idealized
depth profiles of oxygen, a typical nutrient (like
phosphate or nitrate), and alkalinity. Alkalinity, in
this case, has to be understood as a sum parameter for dissolved carbon species which increase
with depth due to the continued decay of organic
material. These patterns, however, may deviate
between the ocean basins depending on the oceanographic setting (currents, mixing of water
masses), the particle-transport through the water
column, and the composition of mineralized
organic matter. Figure 6.2 shows some examples of
the nitrate distribution in different ocean basins.
The deep waters of the Pacific and the Indian
Ocean are enriched in nitrate relative to the North
Atlantic due to deep-water transport through the
ocean basins (see below). As pointed out above,
both nutrients are depleted in the surface water.
The investigation of the key processes has
largely benefited from the invention of sediment
traps measuring the particle flux through the water
column over long periods of time. A number of
researchers have attempted to quantify export
fluxes of organic carbon from surface waters and
their transition to the bottom by empirical
formulations (cf. Section 4.2; e.g. Betzer et al.
1984; Berger et al. 1987; Martin et al. 1987).
Generally, these are exponential and power equations predicting about 90% of the remineralization
within the upper hundreds of meters of the water
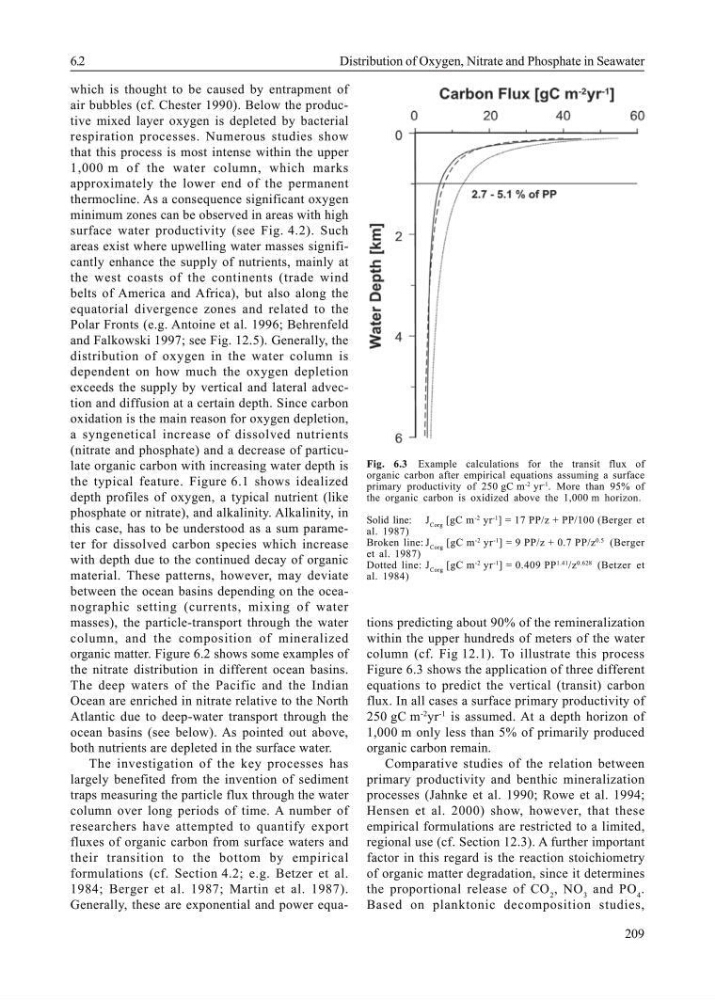
column (cf. Fig 12.1). To illustrate this process
Figure 6.3 shows the application of three different
equations to predict the vertical (transit) carbon
flux. In all cases a surface primary productivity of
250 gC m
-2
yr
-1
is assumed. At a depth horizon of
1,000 m only less than 5% of primarily produced
organic carbon remain.
Comparative studies of the relation between
primary productivity and benthic mineralization
processes (Jahnke et al. 1990; Rowe et al. 1994;
Hensen et al. 2000) show, however, that these
empirical formulations are restricted to a limited,
regional use (cf. Section 12.3). A further important
factor in this regard is the reaction stoichiometry
of organic matter degradation, since it determines
the proportional release of CO 2 , NO 3 and PO 4 .
Based on planktonic decomposition studies,
Fig. 6.3 Example calculations for the transit flux of
organic carbon after empirical equations assuming a surface
primary productivity of 250 gC m
-2 yr
-1 . More than 95% of
the organic carbon is oxidized above the 1,000 m horizon.
Solid line: J Corg [gC m
-2 yr
-1 ] = 17 PP/z + PP/100 (Berger et
al. 1987)
Broken line: J Corg [gC m
-2 yr
-1 ] = 9 PP/z + 0.7 PP/z
0.5 (Berger
et al. 1987)
Dotted line: J Corg [gC m
-2 yr
-1 ] = 0.409 PP
1.41 /z
0.628 (Betzer et
al. 1984)
6.2
Distribution of Oxygen, Nitrate and Phosphate in Seawater
which is thought to be caused by entrapment of
air bubbles (cf. Chester 1990). Below the productive mixed layer oxygen is depleted by bacterial
respiration processes. Numerous studies show
that this process is most intense within the upper
1,000 m of the water column, which marks
approximately the lower end of the permanent
thermocline. As a consequence significant oxygen
minimum zones can be observed in areas with high
surface water productivity (see Fig. 4.2). Such
areas exist where upwelling water masses significantly enhance the supply of nutrients, mainly at
the west coasts of the continents (trade wind
belts of America and Africa), but also along the
equatorial divergence zones and related to the
Polar Fronts (e.g. Antoine et al. 1996; Behrenfeld
and Falkowski 1997; see Fig. 12.5). Generally, the
distribution of oxygen in the water column is
dependent on how much the oxygen depletion
exceeds the supply by vertical and lateral advection and diffusion at a certain depth. Since carbon
oxidation is the main reason for oxygen depletion,
a syngenetical increase of dissolved nutrients
(nitrate and phosphate) and a decrease of particulate organic carbon with increasing water depth is
the typical feature. Figure 6.1 shows idealized
depth profiles of oxygen, a typical nutrient (like
phosphate or nitrate), and alkalinity. Alkalinity, in
this case, has to be understood as a sum parameter for dissolved carbon species which increase
with depth due to the continued decay of organic
material. These patterns, however, may deviate
between the ocean basins depending on the oceanographic setting (currents, mixing of water
masses), the particle-transport through the water
column, and the composition of mineralized
organic matter. Figure 6.2 shows some examples of
the nitrate distribution in different ocean basins.
The deep waters of the Pacific and the Indian
Ocean are enriched in nitrate relative to the North
Atlantic due to deep-water transport through the
ocean basins (see below). As pointed out above,
both nutrients are depleted in the surface water.
The investigation of the key processes has
largely benefited from the invention of sediment
traps measuring the particle flux through the water
column over long periods of time. A number of
researchers have attempted to quantify export
fluxes of organic carbon from surface waters and
their transition to the bottom by empirical
formulations (cf. Section 4.2; e.g. Betzer et al.
1984; Berger et al. 1987; Martin et al. 1987).
Generally, these are exponential and power equations predicting about 90% of the remineralization
within the upper hundreds of meters of the water
column (cf. Fig 12.1). To illustrate this process
Figure 6.3 shows the application of three different
equations to predict the vertical (transit) carbon
flux. In all cases a surface primary productivity of
250 gC m
-2
yr
-1
is assumed. At a depth horizon of
1,000 m only less than 5% of primarily produced
organic carbon remain.
Comparative studies of the relation between
primary productivity and benthic mineralization
processes (Jahnke et al. 1990; Rowe et al. 1994;
Hensen et al. 2000) show, however, that these
empirical formulations are restricted to a limited,
regional use (cf. Section 12.3). A further important
factor in this regard is the reaction stoichiometry
of organic matter degradation, since it determines
the proportional release of CO 2 , NO 3 and PO 4 .
Based on planktonic decomposition studies,
Fig. 6.3 Example calculations for the transit flux of
organic carbon after empirical equations assuming a surface
primary productivity of 250 gC m
-2 yr
-1 . More than 95% of
the organic carbon is oxidized above the 1,000 m horizon.
Solid line: J Corg [gC m
-2 yr
-1 ] = 17 PP/z + PP/100 (Berger et
al. 1987)
Broken line: J Corg [gC m
-2 yr
-1 ] = 9 PP/z + 0.7 PP/z
0.5 (Berger
et al. 1987)
Dotted line: J Corg [gC m
-2 yr
-1 ] = 0.409 PP
1.41 /z
0.628 (Betzer et
al. 1984)