

95
permitting the measurement of the concentrations
afterwards which are oversaturated under conditions of normal atmospheric pressure.
The results of measurements carried out on a
core with high sulfide and methane concentrations
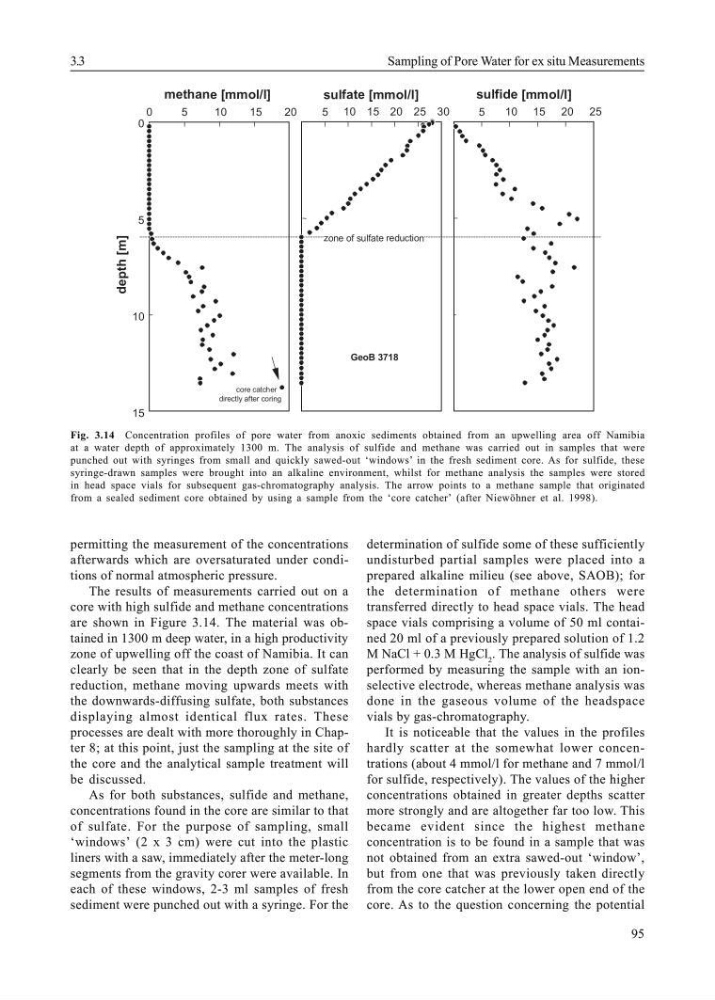
are shown in Figure 3.14. The material was obtained in 1300 m deep water, in a high productivity
zone of upwelling off the coast of Namibia. It can
clearly be seen that in the depth zone of sulfate
reduction, methane moving upwards meets with
the downwards-diffusing sulfate, both substances
displaying almost identical flux rates. These
processes are dealt with more thoroughly in Chapter 8; at this point, just the sampling at the site of
the core and the analytical sample treatment will
be discussed.
As for both substances, sulfide and methane,
concentrations found in the core are similar to that
of sulfate. For the purpose of sampling, small
‘windows’ (2 x 3 cm) were cut into the plastic
liners with a saw, immediately after the meter-long
segments from the gravity corer were available. In
each of these windows, 2-3 ml samples of fresh
sediment were punched out with a syringe. For the
determination of sulfide some of these sufficiently
undisturbed partial samples were placed into a
prepared alkaline milieu (see above, SAOB); for
the determination of methane others were
transferred directly to head space vials. The head
space vials comprising a volume of 50 ml contained 20 ml of a previously prepared solution of 1.2
M NaCl + 0.3 M HgCl 2 . The analysis of sulfide was
performed by measuring the sample with an ionselective electrode, whereas methane analysis was
done in the gaseous volume of the headspace
vials by gas-chromatography.
It is noticeable that the values in the profiles
hardly scatter at the somewhat lower concentrations (about 4 mmol/l for methane and 7 mmol/l
for sulfide, respectively). The values of the higher
concentrations obtained in greater depths scatter
more strongly and are altogether far too low. This
became evident since the highest methane
concentration is to be found in a sample that was
not obtained from an extra sawed-out ‘window’,
but from one that was previously taken directly
from the core catcher at the lower open end of the
core. As to the question concerning the potential
Fig. 3.14 Concentration profiles of pore water from anoxic sediments obtained from an upwelling area off Namibia
at a water depth of approximately 1300 m. The analysis of sulfide and methane was carried out in samples that were
punched out with syringes from small and quickly sawed-out ‘windows’ in the fresh sediment core. As for sulfide, these
syringe-drawn samples were brought into an alkaline environment, whilst for methane analysis the samples were stored
in head space vials for subsequent gas-chromatography analysis. The arrow points to a methane sample that originated
from a sealed sediment core obtained by using a sample from the ‘core catcher’ (after Niewöhner et al. 1998).
3.3
Sampling of Pore Water for ex situ Measurements
0
5
10
15
0
5
10
15
20
methane [mmol/l]
5 10 15 20 25 30
sulfate [mmol/l]
5
10 15 20 25
depth
[m]
sulfide [mmol/l]
GeoB 3718
core catcher
directly after coring
zone of sulfate reduction
permitting the measurement of the concentrations
afterwards which are oversaturated under conditions of normal atmospheric pressure.
The results of measurements carried out on a
core with high sulfide and methane concentrations
are shown in Figure 3.14. The material was obtained in 1300 m deep water, in a high productivity
zone of upwelling off the coast of Namibia. It can
clearly be seen that in the depth zone of sulfate
reduction, methane moving upwards meets with
the downwards-diffusing sulfate, both substances
displaying almost identical flux rates. These
processes are dealt with more thoroughly in Chapter 8; at this point, just the sampling at the site of
the core and the analytical sample treatment will
be discussed.
As for both substances, sulfide and methane,
concentrations found in the core are similar to that
of sulfate. For the purpose of sampling, small
‘windows’ (2 x 3 cm) were cut into the plastic
liners with a saw, immediately after the meter-long
segments from the gravity corer were available. In
each of these windows, 2-3 ml samples of fresh
sediment were punched out with a syringe. For the
determination of sulfide some of these sufficiently
undisturbed partial samples were placed into a
prepared alkaline milieu (see above, SAOB); for
the determination of methane others were
transferred directly to head space vials. The head
space vials comprising a volume of 50 ml contained 20 ml of a previously prepared solution of 1.2
M NaCl + 0.3 M HgCl 2 . The analysis of sulfide was
performed by measuring the sample with an ionselective electrode, whereas methane analysis was
done in the gaseous volume of the headspace
vials by gas-chromatography.
It is noticeable that the values in the profiles
hardly scatter at the somewhat lower concentrations (about 4 mmol/l for methane and 7 mmol/l
for sulfide, respectively). The values of the higher
concentrations obtained in greater depths scatter
more strongly and are altogether far too low. This
became evident since the highest methane
concentration is to be found in a sample that was
not obtained from an extra sawed-out ‘window’,
but from one that was previously taken directly
from the core catcher at the lower open end of the
core. As to the question concerning the potential
Fig. 3.14 Concentration profiles of pore water from anoxic sediments obtained from an upwelling area off Namibia
at a water depth of approximately 1300 m. The analysis of sulfide and methane was carried out in samples that were
punched out with syringes from small and quickly sawed-out ‘windows’ in the fresh sediment core. As for sulfide, these
syringe-drawn samples were brought into an alkaline environment, whilst for methane analysis the samples were stored
in head space vials for subsequent gas-chromatography analysis. The arrow points to a methane sample that originated
from a sealed sediment core obtained by using a sample from the ‘core catcher’ (after Niewöhner et al. 1998).
3.3
Sampling of Pore Water for ex situ Measurements
0
5
10
15
0
5
10
15
20
methane [mmol/l]
5 10 15 20 25 30
sulfate [mmol/l]
5
10 15 20 25
depth
[m]
sulfide [mmol/l]
GeoB 3718
core catcher
directly after coring
zone of sulfate reduction