

82
C. Variations of Stable Isotope Ratios in Nature
O ' o . 4 2 r - - - - - - - - - - - - - - - - - - ,
o
0.0.40. f-o
o
o
~ o..Q38 f-~
x
x
.~
c5' 0..0.361,.
U
o..o.34f-x
0..0.321x •
x -
•
I
-6
-7
0
x
0
I
-8
•
• Yosemite National Park
x Big Sur State Park
o Olympic National Park
I
I
- 9
-10
-11
6 13 C in 0'00
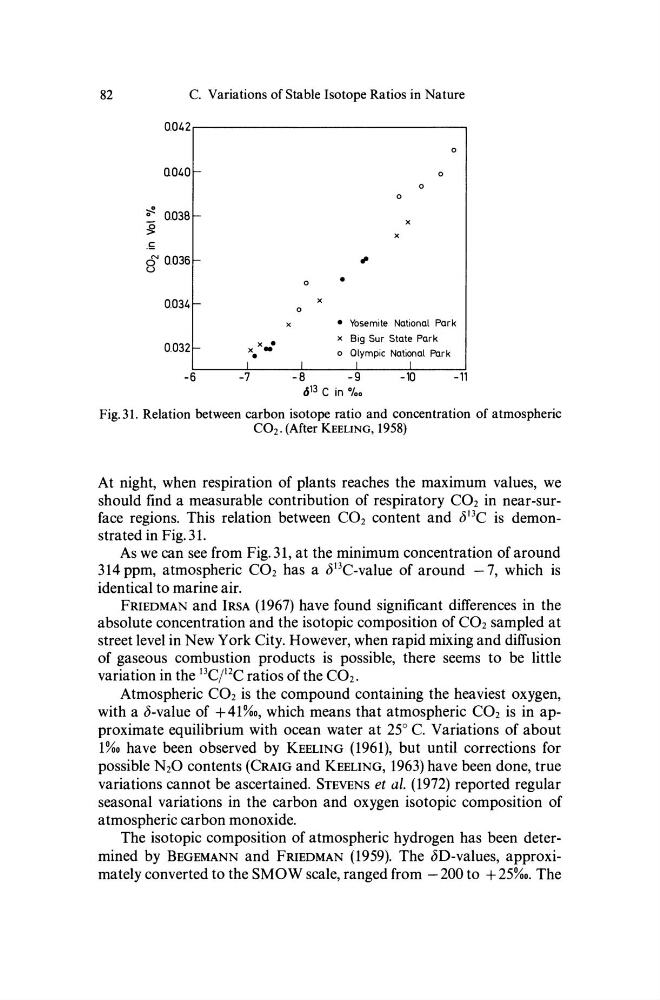
Fig. 31. Relation between carbon isotope ratio and concentration of atmospheric
COz. (After KEELING, 1958)
At night, when respiration of plants reaches the maximum values, we
should find a measurable contribution of respiratory COz in near-surface regions. This relation between CO2 content and J 13 C is demonstrated in Fig. 31.
As we can see from Fig. 31, at the minimum concentration of around
314 ppm, atmospheric COz has a J 13 C-value of around -7, which is
identical to marine air.
FRIEDMAN and IRSA (1967) have found significant differences in the
absolute concentration and the isotopic composition of COz sampled at
street level in New York City. However, when rapid mixing and diffusion
of gaseous combustion products is possible, there seems to be little
variation in the 13CjlZC ratios of the COz.
Atmospheric COz is the compound containing the heaviest oxygen,
with a J-value of +41%0, which means that atmospheric COz is in approximate equilibrium with ocean water at 25° C. Variations of about
1%0 have been observed by KEELING (1961), but until corrections for
possible NzO contents (CRAIG and KEELING, 1963) have been done, true
variations cannot be ascertained. STEVENS et al. (1972) reported regular
seasonal variations in the carbon and oxygen isotopic composition of
atmospheric carbon monoxide.
The isotopic composition of atmospheric hydrogen has been determined by BEGEMANN and FRIEDMAN (1959). The JD-values, approximately converted to the SMOW scale, ranged from - 200 to + 25%0. The
C. Variations of Stable Isotope Ratios in Nature
O ' o . 4 2 r - - - - - - - - - - - - - - - - - - ,
o
0.0.40. f-o
o
o
~ o..Q38 f-~
x
x
.~
c5' 0..0.361,.
U
o..o.34f-x
0..0.321x •
x -
•
I
-6
-7
0
x
0
I
-8
•
• Yosemite National Park
x Big Sur State Park
o Olympic National Park
I
I
- 9
-10
-11
6 13 C in 0'00
Fig. 31. Relation between carbon isotope ratio and concentration of atmospheric
COz. (After KEELING, 1958)
At night, when respiration of plants reaches the maximum values, we
should find a measurable contribution of respiratory COz in near-surface regions. This relation between CO2 content and J 13 C is demonstrated in Fig. 31.
As we can see from Fig. 31, at the minimum concentration of around
314 ppm, atmospheric COz has a J 13 C-value of around -7, which is
identical to marine air.
FRIEDMAN and IRSA (1967) have found significant differences in the
absolute concentration and the isotopic composition of COz sampled at
street level in New York City. However, when rapid mixing and diffusion
of gaseous combustion products is possible, there seems to be little
variation in the 13CjlZC ratios of the COz.
Atmospheric COz is the compound containing the heaviest oxygen,
with a J-value of +41%0, which means that atmospheric COz is in approximate equilibrium with ocean water at 25° C. Variations of about
1%0 have been observed by KEELING (1961), but until corrections for
possible NzO contents (CRAIG and KEELING, 1963) have been done, true
variations cannot be ascertained. STEVENS et al. (1972) reported regular
seasonal variations in the carbon and oxygen isotopic composition of
atmospheric carbon monoxide.
The isotopic composition of atmospheric hydrogen has been determined by BEGEMANN and FRIEDMAN (1959). The JD-values, approximately converted to the SMOW scale, ranged from - 200 to + 25%0. The