

shown the occurrence of the phenomenon in 2005 and 2006 (Quin et al. 2007;
Engvall et al. 2008; Rozwadowska et al. 2010). The occurrence of the strongest
events during summer 2004, 2010 and spring 2006, 2008 are classified as extreme
events. Those high AOD values have been related to the inflow of continental air
masses.
A general overview of the data gives the information that the Aerosol Optical
Depth is much higher these years than a decade before. With respect to the
Ångström Exponent, which almost always follows the AOD values, most of its
higher values should be related to the anthropogenic influence. Each year the most
frequent value oscillates around 1.2–1.5, but between 2001 and 2011 they went up
from 0.732 to 1.835.
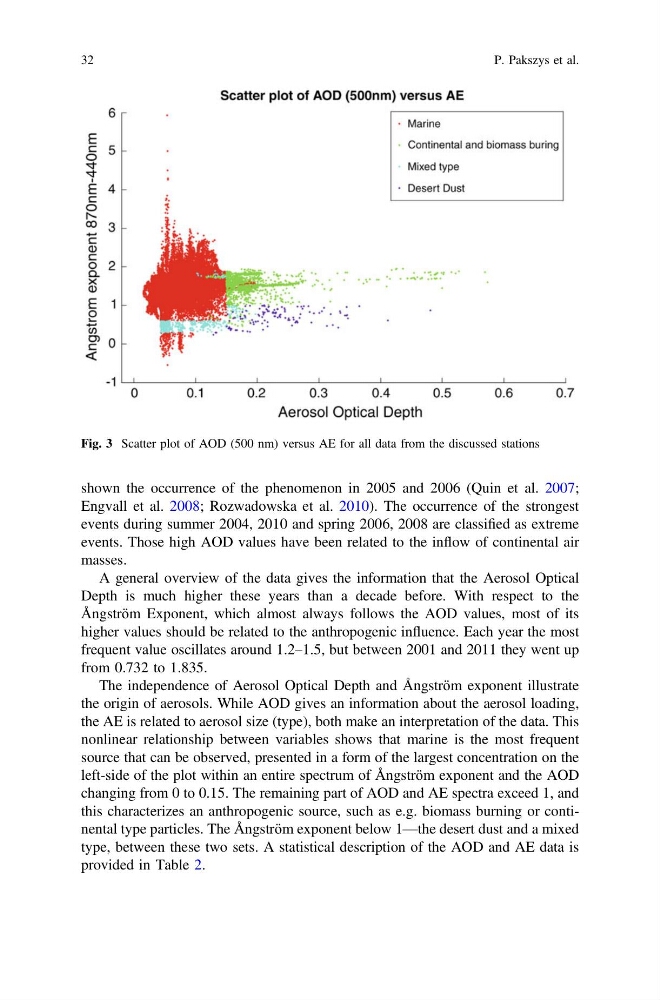
The independence of Aerosol Optical Depth and Ångström exponent illustrate
the origin of aerosols. While AOD gives an information about the aerosol loading,
the AE is related to aerosol size (type), both make an interpretation of the data. This
nonlinear relationship between variables shows that marine is the most frequent
source that can be observed, presented in a form of the largest concentration on the
left-side of the plot within an entire spectrum of Ångström exponent and the AOD
changing from 0 to 0.15. The remaining part of AOD and AE spectra exceed 1, and
this characterizes an anthropogenic source, such as e.g. biomass burning or continental type particles. The Ångström exponent below 1—the desert dust and a mixed
type, between these two sets. A statistical description of the AOD and AE data is
provided in Table 2.
Fig. 3 Scatter plot of AOD (500 nm) versus AE for all data from the discussed stations
32
P. Pakszys et al.
Engvall et al. 2008; Rozwadowska et al. 2010). The occurrence of the strongest
events during summer 2004, 2010 and spring 2006, 2008 are classified as extreme
events. Those high AOD values have been related to the inflow of continental air
masses.
A general overview of the data gives the information that the Aerosol Optical
Depth is much higher these years than a decade before. With respect to the
Ångström Exponent, which almost always follows the AOD values, most of its
higher values should be related to the anthropogenic influence. Each year the most
frequent value oscillates around 1.2–1.5, but between 2001 and 2011 they went up
from 0.732 to 1.835.
The independence of Aerosol Optical Depth and Ångström exponent illustrate
the origin of aerosols. While AOD gives an information about the aerosol loading,
the AE is related to aerosol size (type), both make an interpretation of the data. This
nonlinear relationship between variables shows that marine is the most frequent
source that can be observed, presented in a form of the largest concentration on the
left-side of the plot within an entire spectrum of Ångström exponent and the AOD
changing from 0 to 0.15. The remaining part of AOD and AE spectra exceed 1, and
this characterizes an anthropogenic source, such as e.g. biomass burning or continental type particles. The Ångström exponent below 1—the desert dust and a mixed
type, between these two sets. A statistical description of the AOD and AE data is
provided in Table 2.
Fig. 3 Scatter plot of AOD (500 nm) versus AE for all data from the discussed stations
32
P. Pakszys et al.