

3. Desert Dust aerosols
Particles are characterized by very turbid atmosphere. Very similar values of AOD
result in low AE values. The AOD increase from 0.2–0.3 up to 1.2 against
decreasing values of AE from 1 to 0.
4. Mixed types of aerosols
Coastal and marine produce a mixed type—with typical AOD < 0.15 and AE 0.3–
0.6.
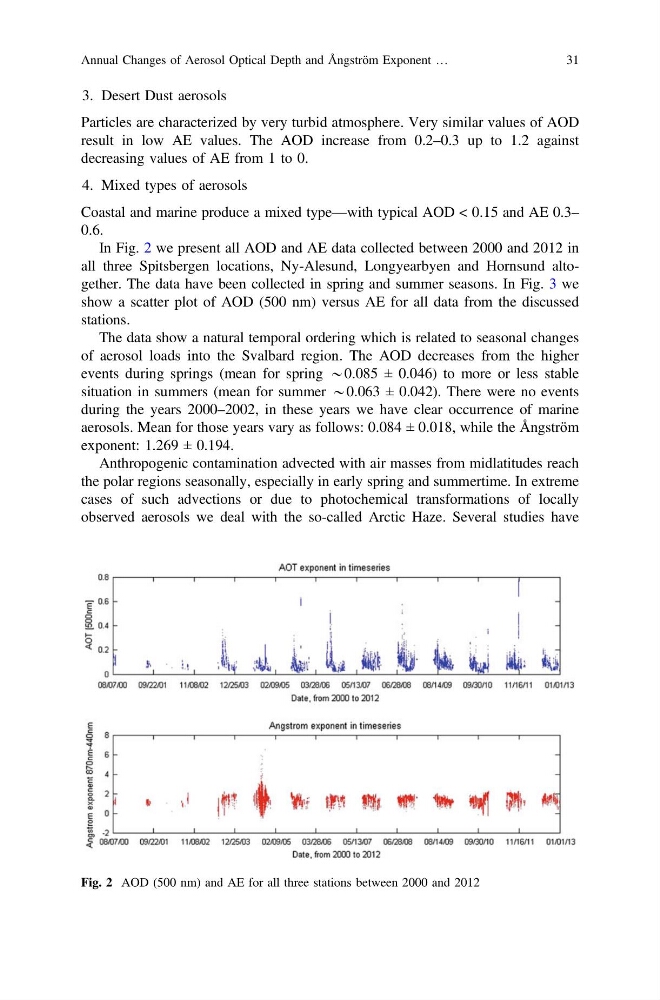
In Fig. 2 we present all AOD and AE data collected between 2000 and 2012 in
all three Spitsbergen locations, Ny-Alesund, Longyearbyen and Hornsund altogether. The data have been collected in spring and summer seasons. In Fig. 3 we
show a scatter plot of AOD (500 nm) versus AE for all data from the discussed
stations.
The data show a natural temporal ordering which is related to seasonal changes
of aerosol loads into the Svalbard region. The AOD decreases from the higher
events during springs (mean for spring *0.085 ± 0.046) to more or less stable
situation in summers (mean for summer *0.063 ± 0.042). There were no events
during the years 2000–2002, in these years we have clear occurrence of marine
aerosols. Mean for those years vary as follows: 0.084 ± 0.018, while the Ångström
exponent: 1.269 ± 0.194.
Anthropogenic contamination advected with air masses from midlatitudes reach
the polar regions seasonally, especially in early spring and summertime. In extreme
cases of such advections or due to photochemical transformations of locally
observed aerosols we deal with the so-called Arctic Haze. Several studies have
Fig. 2 AOD (500 nm) and AE for all three stations between 2000 and 2012
Annual Changes of Aerosol Optical Depth and Ångström Exponent …
31
Particles are characterized by very turbid atmosphere. Very similar values of AOD
result in low AE values. The AOD increase from 0.2–0.3 up to 1.2 against
decreasing values of AE from 1 to 0.
4. Mixed types of aerosols
Coastal and marine produce a mixed type—with typical AOD < 0.15 and AE 0.3–
0.6.
In Fig. 2 we present all AOD and AE data collected between 2000 and 2012 in
all three Spitsbergen locations, Ny-Alesund, Longyearbyen and Hornsund altogether. The data have been collected in spring and summer seasons. In Fig. 3 we
show a scatter plot of AOD (500 nm) versus AE for all data from the discussed
stations.
The data show a natural temporal ordering which is related to seasonal changes
of aerosol loads into the Svalbard region. The AOD decreases from the higher
events during springs (mean for spring *0.085 ± 0.046) to more or less stable
situation in summers (mean for summer *0.063 ± 0.042). There were no events
during the years 2000–2002, in these years we have clear occurrence of marine
aerosols. Mean for those years vary as follows: 0.084 ± 0.018, while the Ångström
exponent: 1.269 ± 0.194.
Anthropogenic contamination advected with air masses from midlatitudes reach
the polar regions seasonally, especially in early spring and summertime. In extreme
cases of such advections or due to photochemical transformations of locally
observed aerosols we deal with the so-called Arctic Haze. Several studies have
Fig. 2 AOD (500 nm) and AE for all three stations between 2000 and 2012
Annual Changes of Aerosol Optical Depth and Ångström Exponent …
31