

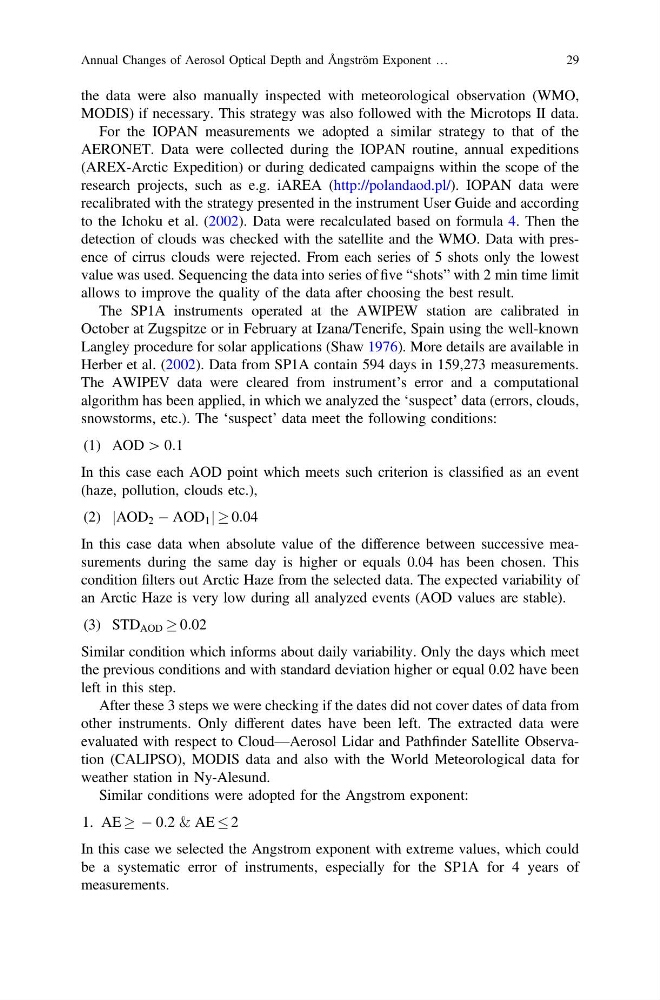
the data were also manually inspected with meteorological observation (WMO,
MODIS) if necessary. This strategy was also followed with the Microtops II data.
For the IOPAN measurements we adopted a similar strategy to that of the
AERONET. Data were collected during the IOPAN routine, annual expeditions
(AREX-Arctic Expedition) or during dedicated campaigns within the scope of the
research projects, such as e.g. iAREA (http://polandaod.pl/). IOPAN data were
recalibrated with the strategy presented in the instrument User Guide and according
to the Ichoku et al. (2002). Data were recalculated based on formula 4. Then the
detection of clouds was checked with the satellite and the WMO. Data with presence of cirrus clouds were rejected. From each series of 5 shots only the lowest
value was used. Sequencing the data into series of five “shots” with 2 min time limit
allows to improve the quality of the data after choosing the best result.
The SP1A instruments operated at the AWIPEW station are calibrated in
October at Zugspitze or in February at Izana/Tenerife, Spain using the well-known
Langley procedure for solar applications (Shaw 1976). More details are available in
Herber et al. (2002). Data from SP1A contain 594 days in 159,273 measurements.
The AWIPEV data were cleared from instrument’s error and a computational
algorithm has been applied, in which we analyzed the ‘suspect’ data (errors, clouds,
snowstorms, etc.). The ‘suspect’ data meet the following conditions:
(1) AOD [ 0:1
In this case each AOD point which meets such criterion is classified as an event
(haze, pollution, clouds etc.),
(2) AOD 2 À AOD 1
j
j ! 0:04
In this case data when absolute value of the difference between successive measurements during the same day is higher or equals 0.04 has been chosen. This
condition filters out Arctic Haze from the selected data. The expected variability of
an Arctic Haze is very low during all analyzed events (AOD values are stable).
(3) STD AOD ! 0:02
Similar condition which informs about daily variability. Only the days which meet
the previous conditions and with standard deviation higher or equal 0.02 have been
left in this step.
After these 3 steps we were checking if the dates did not cover dates of data from
other instruments. Only different dates have been left. The extracted data were
evaluated with respect to Cloud—Aerosol Lidar and Pathfinder Satellite Observation (CALIPSO), MODIS data and also with the World Meteorological data for
weather station in Ny-Alesund.
Similar conditions were adopted for the Angstrom exponent:
1. AE ! À 0:2 & AE 2
In this case we selected the Angstrom exponent with extreme values, which could
be a systematic error of instruments, especially for the SP1A for 4 years of
measurements.
Annual Changes of Aerosol Optical Depth and Ångström Exponent …
29
MODIS) if necessary. This strategy was also followed with the Microtops II data.
For the IOPAN measurements we adopted a similar strategy to that of the
AERONET. Data were collected during the IOPAN routine, annual expeditions
(AREX-Arctic Expedition) or during dedicated campaigns within the scope of the
research projects, such as e.g. iAREA (http://polandaod.pl/). IOPAN data were
recalibrated with the strategy presented in the instrument User Guide and according
to the Ichoku et al. (2002). Data were recalculated based on formula 4. Then the
detection of clouds was checked with the satellite and the WMO. Data with presence of cirrus clouds were rejected. From each series of 5 shots only the lowest
value was used. Sequencing the data into series of five “shots” with 2 min time limit
allows to improve the quality of the data after choosing the best result.
The SP1A instruments operated at the AWIPEW station are calibrated in
October at Zugspitze or in February at Izana/Tenerife, Spain using the well-known
Langley procedure for solar applications (Shaw 1976). More details are available in
Herber et al. (2002). Data from SP1A contain 594 days in 159,273 measurements.
The AWIPEV data were cleared from instrument’s error and a computational
algorithm has been applied, in which we analyzed the ‘suspect’ data (errors, clouds,
snowstorms, etc.). The ‘suspect’ data meet the following conditions:
(1) AOD [ 0:1
In this case each AOD point which meets such criterion is classified as an event
(haze, pollution, clouds etc.),
(2) AOD 2 À AOD 1
j
j ! 0:04
In this case data when absolute value of the difference between successive measurements during the same day is higher or equals 0.04 has been chosen. This
condition filters out Arctic Haze from the selected data. The expected variability of
an Arctic Haze is very low during all analyzed events (AOD values are stable).
(3) STD AOD ! 0:02
Similar condition which informs about daily variability. Only the days which meet
the previous conditions and with standard deviation higher or equal 0.02 have been
left in this step.
After these 3 steps we were checking if the dates did not cover dates of data from
other instruments. Only different dates have been left. The extracted data were
evaluated with respect to Cloud—Aerosol Lidar and Pathfinder Satellite Observation (CALIPSO), MODIS data and also with the World Meteorological data for
weather station in Ny-Alesund.
Similar conditions were adopted for the Angstrom exponent:
1. AE ! À 0:2 & AE 2
In this case we selected the Angstrom exponent with extreme values, which could
be a systematic error of instruments, especially for the SP1A for 4 years of
measurements.
Annual Changes of Aerosol Optical Depth and Ångström Exponent …
29