

Section 2.4: Misleading Names
21
We have seen that the name "Decorrelation Time" is not based on physical
reasoning but on strictly mathematical grounds. Nevertheless the number is
often incorrectly interpreted as the minimum time so that two consecutive
observations X t and Xt+TD are independent. If used as a vague estimate
with the reservat ions mentioned above, such a use is in order. However, the
number is often introduced as crucial parameter in test routines. Probably
the most frequent victim of this misuse is the conventional t-test.
We illustrate this case by a simple example from Zwiers and von Storch
(1995): We want to answer the question whether the long-term mean winter
temperatures in Hamburg and Victoria are equal. To answer this question,
we have at our disposal daily observations for one winter from both locations.
We treat the winter temperatures at both locations as random variables, say
TH and Tv. The "long term mean" winter temperatures at the two locations, denoted as ILH and ILv respectively, are parameters of the prob ability
distributions of these random variables. In the statistial nomenclature the
quest ion we pose is: do the sampies of temperature observations contain
sufficient evidence to reject the null hypothesis Ho : ILH - ILv = O.
The standard approach to this problem is to use to the Student 's t-test.
The test is conducted by imposing a statistical model upon the processes
which resulted in the temperature sampies and then, within the confines of
this model, measuring the degree to which the data agree with Ho. An essential part of the model which is implicit in the t-test is the assumption that the
data which enter the test represent a set of statistically independent observations. In our case, and in many other applications in climate research, this
assumption is not satisfied. The Student's t-test usually becomes "liberal"
in these circumstances. That is, it tends to reject that null hypothesis on
weaker evidence than is implied by the significance level 5 which is specified
for the test. One manifestation of this problem is that the Student's t-test
will reject the null hypothesis more frequently than expected when the null
hypo thesis is true.
A relatively clean and simple solution to this problem is to form subsampies of approximately independent observations from the observations. In
the case of daily temperature data, one might use physical insight to argue
that observations which are, say, 5 days apart, are effectively independent
of each other. If the number of sampies, the sampie means and standard
deviations from these reduced data sets are denoted by n*, T~, T~, u~ and
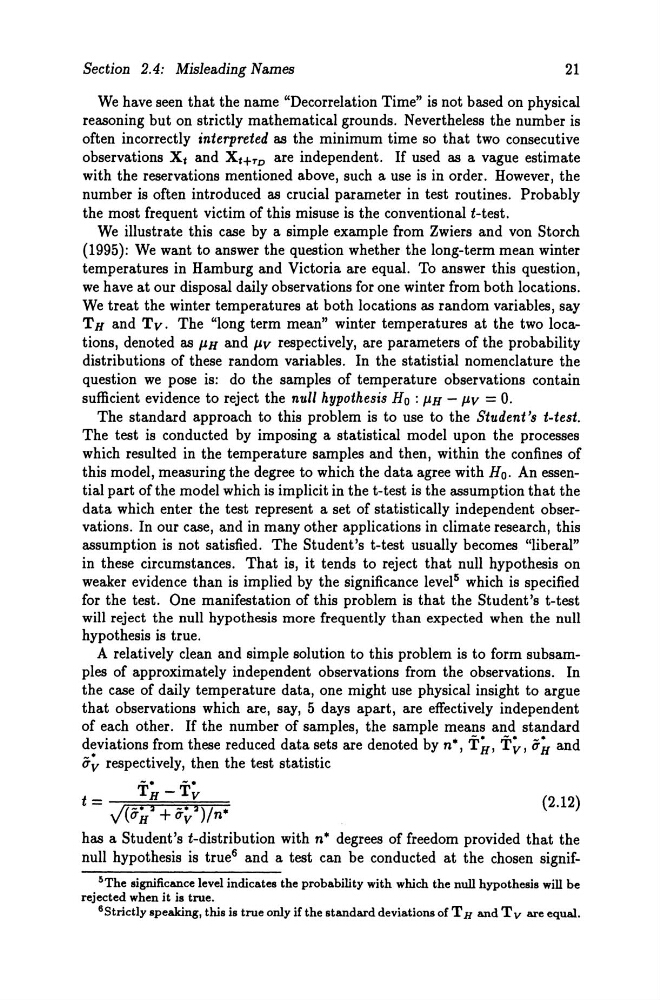
u~ respectively, then the test statistic
t =
T~ -T~
J(u~:I + u~ :I)/n*
(2.12)
has a Student's t-distribution with n* degrees of freedom provided that the
null hypothesis is true 6 and a test can be conducted at the chosen signif.l)The significance level indicates the probability with which the null hypothesis will be
rejected when it is true.
6Strictly speaking, this is true only if the standard deviations of T H and T v are equal.
21
We have seen that the name "Decorrelation Time" is not based on physical
reasoning but on strictly mathematical grounds. Nevertheless the number is
often incorrectly interpreted as the minimum time so that two consecutive
observations X t and Xt+TD are independent. If used as a vague estimate
with the reservat ions mentioned above, such a use is in order. However, the
number is often introduced as crucial parameter in test routines. Probably
the most frequent victim of this misuse is the conventional t-test.
We illustrate this case by a simple example from Zwiers and von Storch
(1995): We want to answer the question whether the long-term mean winter
temperatures in Hamburg and Victoria are equal. To answer this question,
we have at our disposal daily observations for one winter from both locations.
We treat the winter temperatures at both locations as random variables, say
TH and Tv. The "long term mean" winter temperatures at the two locations, denoted as ILH and ILv respectively, are parameters of the prob ability
distributions of these random variables. In the statistial nomenclature the
quest ion we pose is: do the sampies of temperature observations contain
sufficient evidence to reject the null hypothesis Ho : ILH - ILv = O.
The standard approach to this problem is to use to the Student 's t-test.
The test is conducted by imposing a statistical model upon the processes
which resulted in the temperature sampies and then, within the confines of
this model, measuring the degree to which the data agree with Ho. An essential part of the model which is implicit in the t-test is the assumption that the
data which enter the test represent a set of statistically independent observations. In our case, and in many other applications in climate research, this
assumption is not satisfied. The Student's t-test usually becomes "liberal"
in these circumstances. That is, it tends to reject that null hypothesis on
weaker evidence than is implied by the significance level 5 which is specified
for the test. One manifestation of this problem is that the Student's t-test
will reject the null hypothesis more frequently than expected when the null
hypo thesis is true.
A relatively clean and simple solution to this problem is to form subsampies of approximately independent observations from the observations. In
the case of daily temperature data, one might use physical insight to argue
that observations which are, say, 5 days apart, are effectively independent
of each other. If the number of sampies, the sampie means and standard
deviations from these reduced data sets are denoted by n*, T~, T~, u~ and
u~ respectively, then the test statistic
t =
T~ -T~
J(u~:I + u~ :I)/n*
(2.12)
has a Student's t-distribution with n* degrees of freedom provided that the
null hypothesis is true 6 and a test can be conducted at the chosen signif.l)The significance level indicates the probability with which the null hypothesis will be
rejected when it is true.
6Strictly speaking, this is true only if the standard deviations of T H and T v are equal.