

Section 13.4: Canonical Correlation Analysis
255
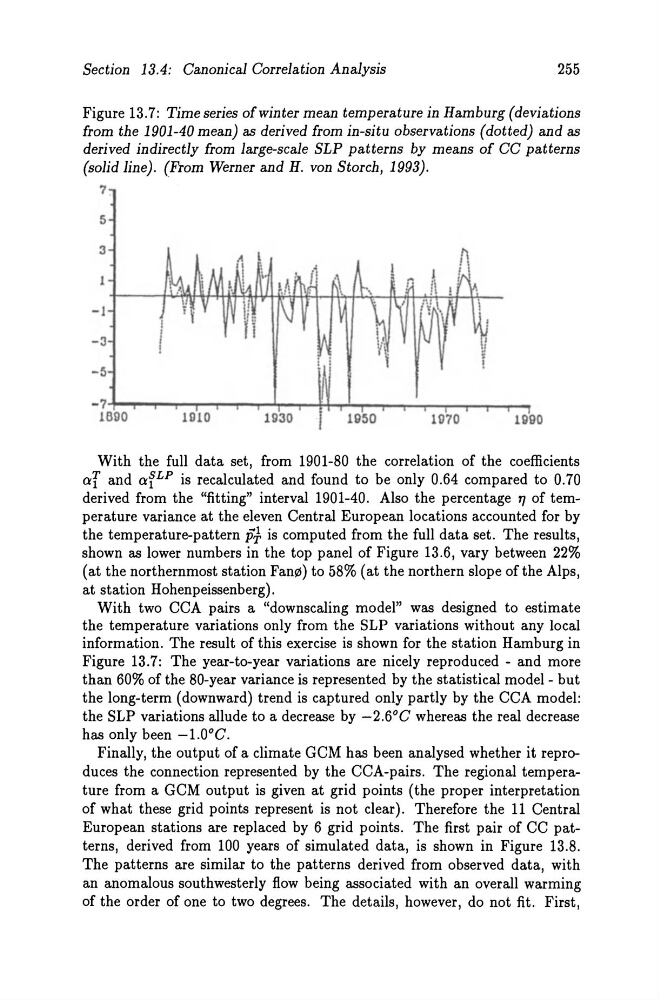
Figure 13.7: Timeseries ofwinter mean temperature in Hamburg (deviations
from the 1901-40 mean) as derived from in-situ observations (dotted) and as
derived indirect1y from large-scale SLP patterns by means of CC patterns
(solid line). (From Werner and H. von Storch, 1993) .
.,
5
:1
-I
-3
-5
uao
1930
1950
ID70
1990
With the fuH data set, from 1901-80 the correlation of the coefficients
0:[ and O:fLP is recalculated and found to be only 0.64 compared to 0.70
derived from the "fitting" interval 1901-40. Also the percentage 1] of temperature variance at the eleven Central European locations accounted for by
the temperature-pattern pi is computed from the fuH data set. The results,
shown as lower numbers in the top panel of Figure 13.6, vary between 22%
(at the northernmost station Fan!2l) to 58% (at the northern slope of the Alps,
at station Hohenpeissenberg).
With two CCA pairs a "downscaling model" was designed to estimate
the temperature variations only from the SLP variations without any local
information. The result of this exercise is shown for the station Hamburg in
Figure 13.7: The year-to-year variations are nicely reproduced - and more
than 60% of the 80-year variance is represented by the statistical model- but
the long-term (downward) trend is captured only partly by the CCA model:
the SLP variations aHude to a decrease by -2.6°C whereas the real decrease
has only been -1.0°C.
FinaHy, the output of a climate GCM has been analysed wh ether it reproduces the connection represented by the CCA-pairs. The regional temperatu re from a GCM output is given at grid points (the proper interpretation
of what these grid points represent is not clear). Therefore the 11 Central
European stations are replaced by 6 grid points. The first pair of CC patterns, derived from 100 years of simulated data, is shown in Figure 13.8.
The patterns are similar to the patterns derived from observed data, with
an anomalous southwesterly flow being associated with an overall warming
of the order of one to two degrees. The details, however, do not fit. First,
255
Figure 13.7: Timeseries ofwinter mean temperature in Hamburg (deviations
from the 1901-40 mean) as derived from in-situ observations (dotted) and as
derived indirect1y from large-scale SLP patterns by means of CC patterns
(solid line). (From Werner and H. von Storch, 1993) .
.,
5
:1
-I
-3
-5
uao
1930
1950
ID70
1990
With the fuH data set, from 1901-80 the correlation of the coefficients
0:[ and O:fLP is recalculated and found to be only 0.64 compared to 0.70
derived from the "fitting" interval 1901-40. Also the percentage 1] of temperature variance at the eleven Central European locations accounted for by
the temperature-pattern pi is computed from the fuH data set. The results,
shown as lower numbers in the top panel of Figure 13.6, vary between 22%
(at the northernmost station Fan!2l) to 58% (at the northern slope of the Alps,
at station Hohenpeissenberg).
With two CCA pairs a "downscaling model" was designed to estimate
the temperature variations only from the SLP variations without any local
information. The result of this exercise is shown for the station Hamburg in
Figure 13.7: The year-to-year variations are nicely reproduced - and more
than 60% of the 80-year variance is represented by the statistical model- but
the long-term (downward) trend is captured only partly by the CCA model:
the SLP variations aHude to a decrease by -2.6°C whereas the real decrease
has only been -1.0°C.
FinaHy, the output of a climate GCM has been analysed wh ether it reproduces the connection represented by the CCA-pairs. The regional temperatu re from a GCM output is given at grid points (the proper interpretation
of what these grid points represent is not clear). Therefore the 11 Central
European stations are replaced by 6 grid points. The first pair of CC patterns, derived from 100 years of simulated data, is shown in Figure 13.8.
The patterns are similar to the patterns derived from observed data, with
an anomalous southwesterly flow being associated with an overall warming
of the order of one to two degrees. The details, however, do not fit. First,