

Section 9.2: Motivation
163
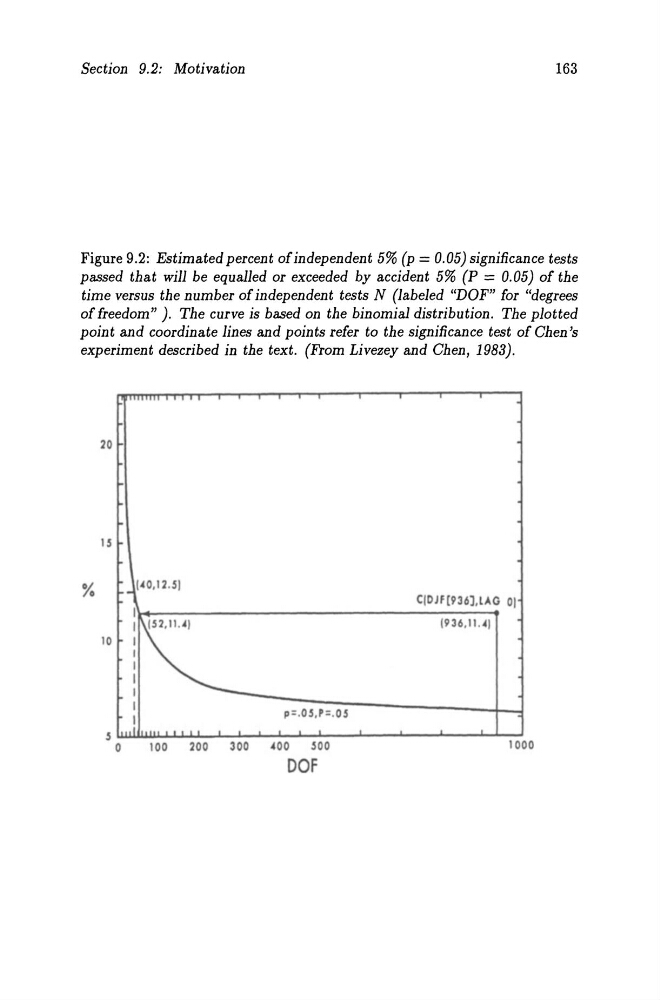
Figure 9.2: Estimated percent ofindependent 5% (p = 0.05) significance tests
passed that will be equalled or exceeded by accident 5% (P = 0.05) of the
time versus the number of independent tests N (Jabeled "DOF" for "degrees
of freedom" ). The curve is based on the binomial distribution. The plotted
point and coordinate lines and points refer to the significance test of Chen 's
experiment described in the text. (From Livezey and Chen, 1983).
20
~
15
%
._1"0,12.51
I
10
i~
I
5 .l
0
100
200
300
p= .05,P=.05
.. 00
500
DOF
. .
C(DJf[936J,lAG 01
1936,11.4)
1000
163
Figure 9.2: Estimated percent ofindependent 5% (p = 0.05) significance tests
passed that will be equalled or exceeded by accident 5% (P = 0.05) of the
time versus the number of independent tests N (Jabeled "DOF" for "degrees
of freedom" ). The curve is based on the binomial distribution. The plotted
point and coordinate lines and points refer to the significance test of Chen 's
experiment described in the text. (From Livezey and Chen, 1983).
20
~
15
%
._1"0,12.51
I
10
i~
I
5 .l
0
100
200
300
p= .05,P=.05
.. 00
500
DOF
. .
C(DJf[936J,lAG 01
1936,11.4)
1000