

162
Chapter 9: Field Intercomparison
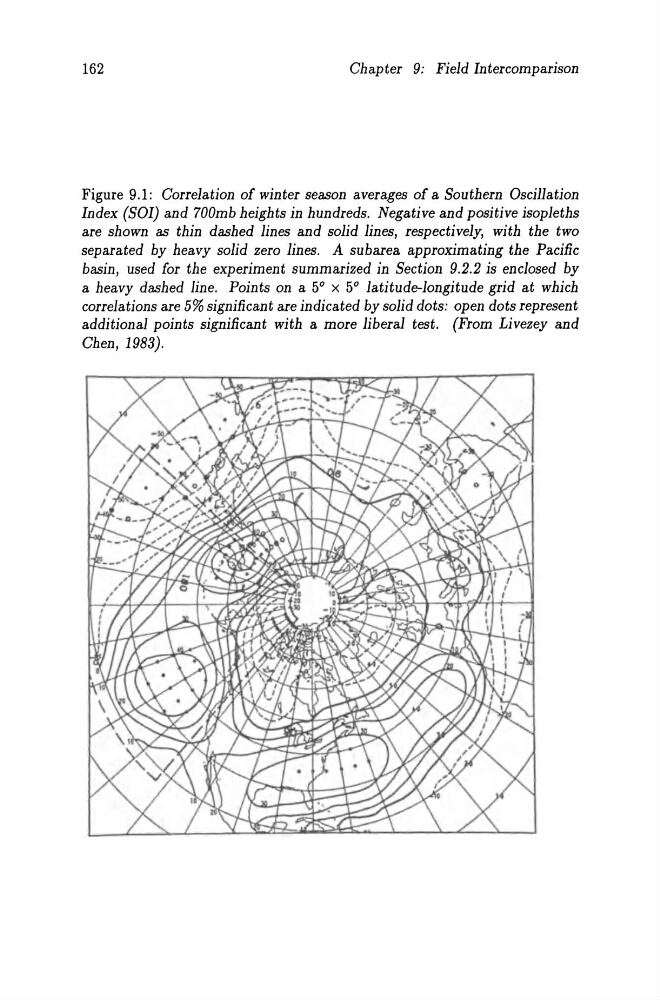
Figure 9.1: Correlation of winter season averages of a Southern Oscillation
Index (SOl) and 700mb heights in hundreds. Negative and positive isopleths
are shown as thin dashed lines and solid lines, respectively, with the two
separated by heavy solid zero lines. A subarea approximating the Pacific
basin, used for the experiment summarized in Section 9.2.2 is enc10sed by
a heavy dashed line. Points on a 5° x 5° latitude-longitude grid at which
correlations are 5% significant are indicated by solid dots: open dots represent
additional points significant with a more liberal test. (From Livezey and
Chen, 1983).
Chapter 9: Field Intercomparison
Figure 9.1: Correlation of winter season averages of a Southern Oscillation
Index (SOl) and 700mb heights in hundreds. Negative and positive isopleths
are shown as thin dashed lines and solid lines, respectively, with the two
separated by heavy solid zero lines. A subarea approximating the Pacific
basin, used for the experiment summarized in Section 9.2.2 is enc10sed by
a heavy dashed line. Points on a 5° x 5° latitude-longitude grid at which
correlations are 5% significant are indicated by solid dots: open dots represent
additional points significant with a more liberal test. (From Livezey and
Chen, 1983).